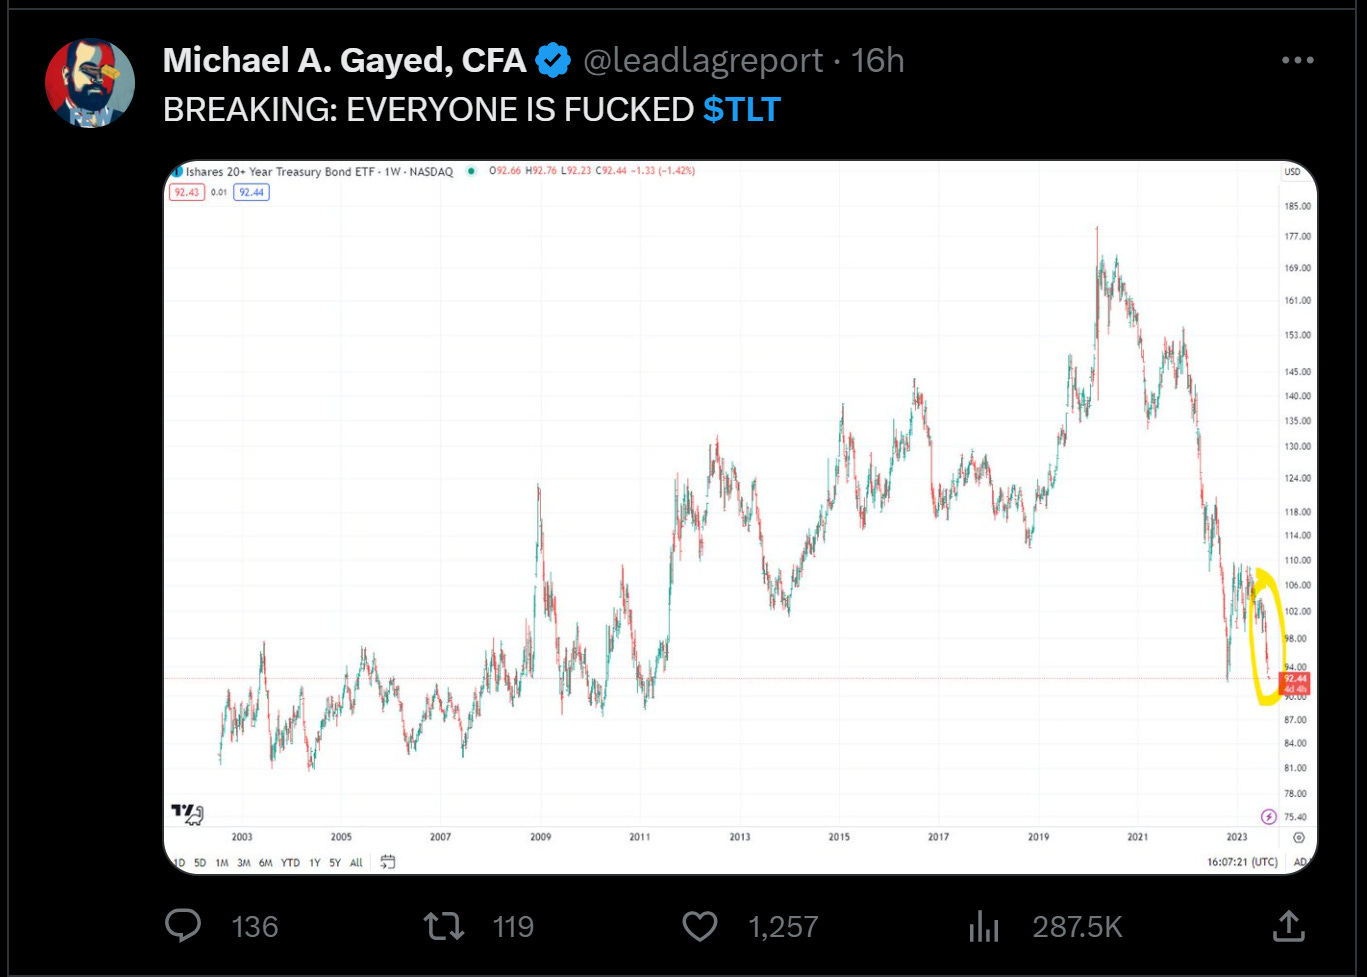
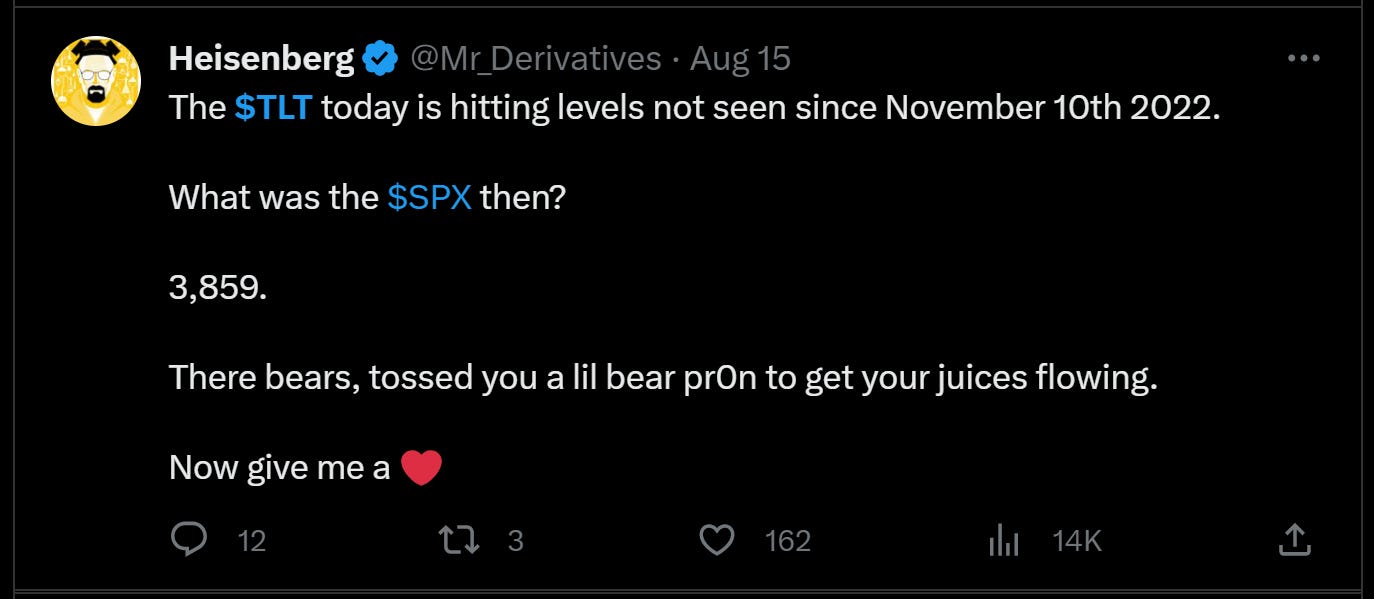
Retail degenerates mostly use technical analysis in day trading, with their CaNdLeStIcK PaTtErNs and their HeAd aNd sHoUldErS.
You might assume that I, personally, completely agree with those who classify technical analysis as astrology for traders... But do I?
Well, sure, I hate the ‘bullish flags’ or ‘bearish harami’ or whatever wacky candlestick patterns are out there.
But, the notions of trading with the moving average, support, and resistance do work, and there is evidence of it.
Trading greats like Stanley Druckenmiller, Paul Tudor Jones, and so on have employed this form of technical analysis while making a fortune, along with predicting market crashes pretty well.
Now, obviously, me, and even probably you, lack the braincells needed to do this, but I just may have found something that has worked in the past, and may work again in the future.
It is a form of technical analysis that feels stupid to use … and that is exactly why it just might work.
I have a metric that is quite good in predicting market declines or rallies in TLT (20+ Year Treasury Bond ETF)
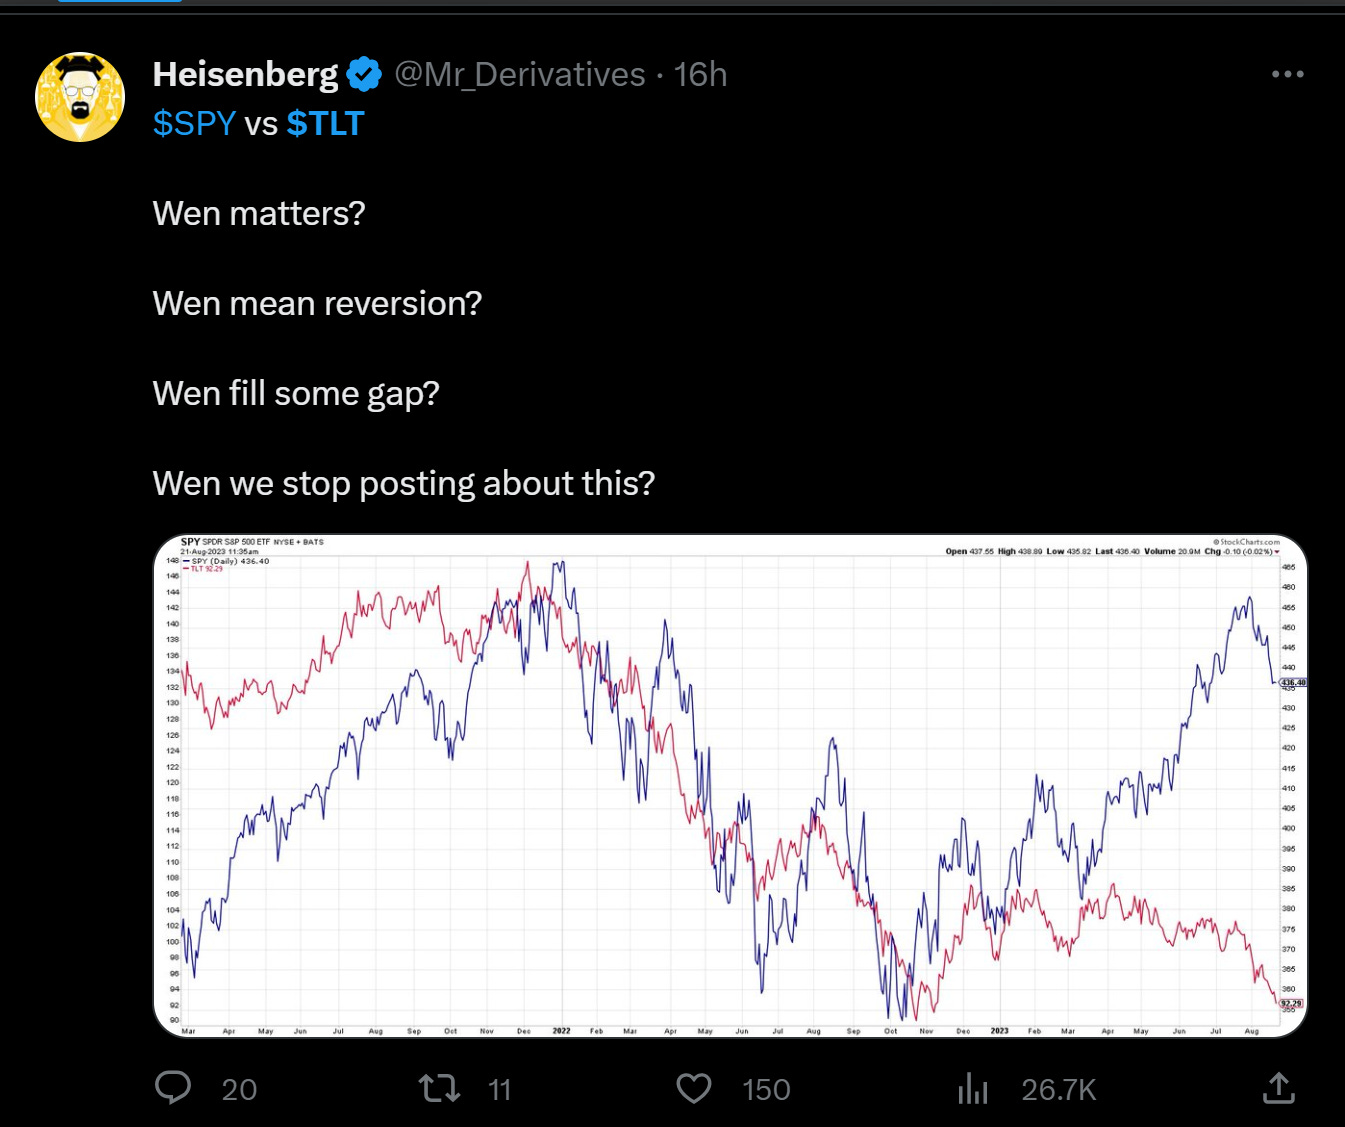
TLT is an ETF(for newbies, a fund that behaves as a stock) that tracks long-term bond prices. It is pretty inversely correlated to the S&P 500, which is widely accepted as the benchmark for US Stocks:

Basically, when S&P goes up, TLT goes down … and vice versa.
One might think that if they know where one of the tickers would go, they can predict where the other would go. And that is pretty true … most of the time.
Remember, stocks can defy all the rules they are supposed to obey, whenever they want:

I had to post the scene from Wolf of Wall Street above
But, for simplicity, we shall assume that whenever TLT goes down/up, S&P HAS to go up/down.
So, let’s see the chart for TLT:
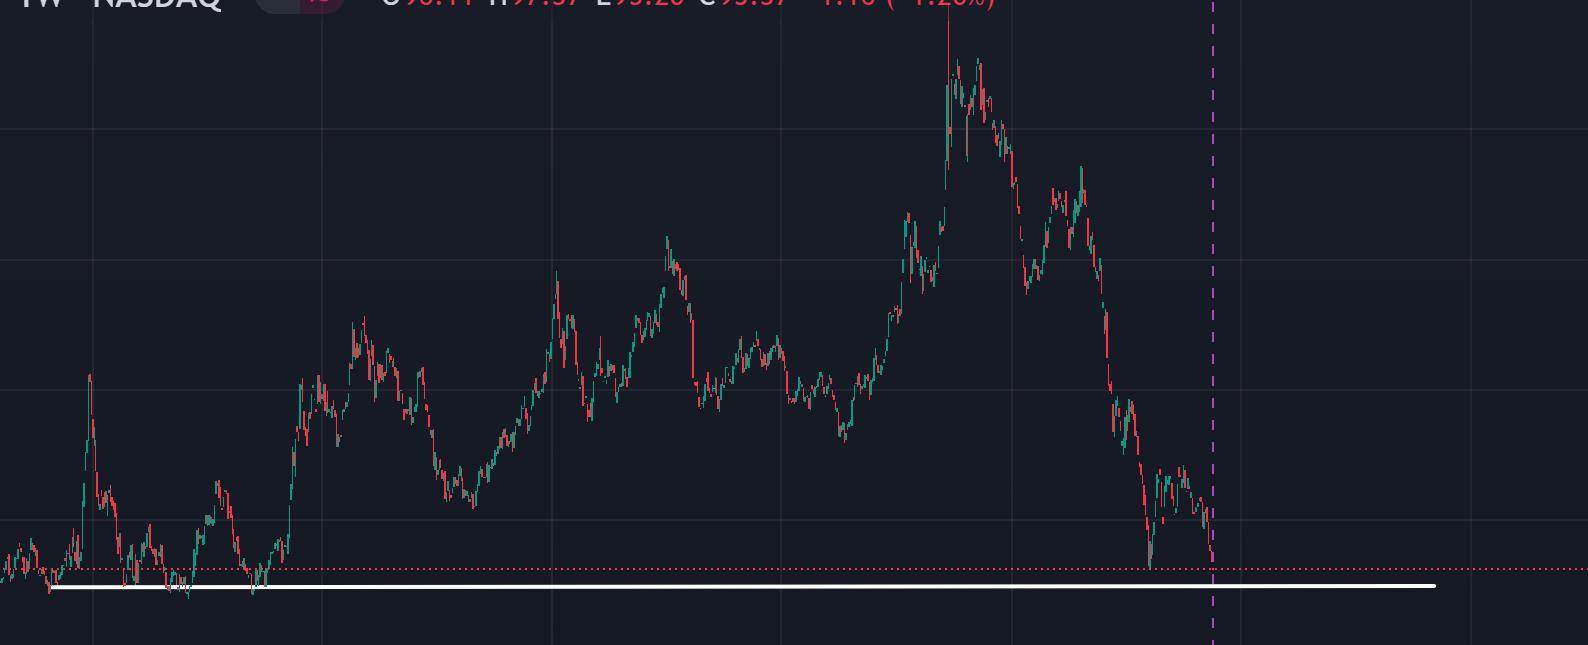
Going entirely based on technical analysis, you can see that the TLT is set for a rebound, and is set to increase.
But, is there a method that would have allowed us to predict the other increases in the past, when it was not near the white line?
Probably.
Have I found it ?
Probably not.
But here is what I think:
Basically, a hard-and-fast rule about bonds is that when Bond Yields increase, Bond prices decrease, and vice versa.
TLT measures Bond prices(roughly)
So, if TLT goes down, Bond yields go up.
There is an Index that tracks the Bond yields as well, known as TNX:
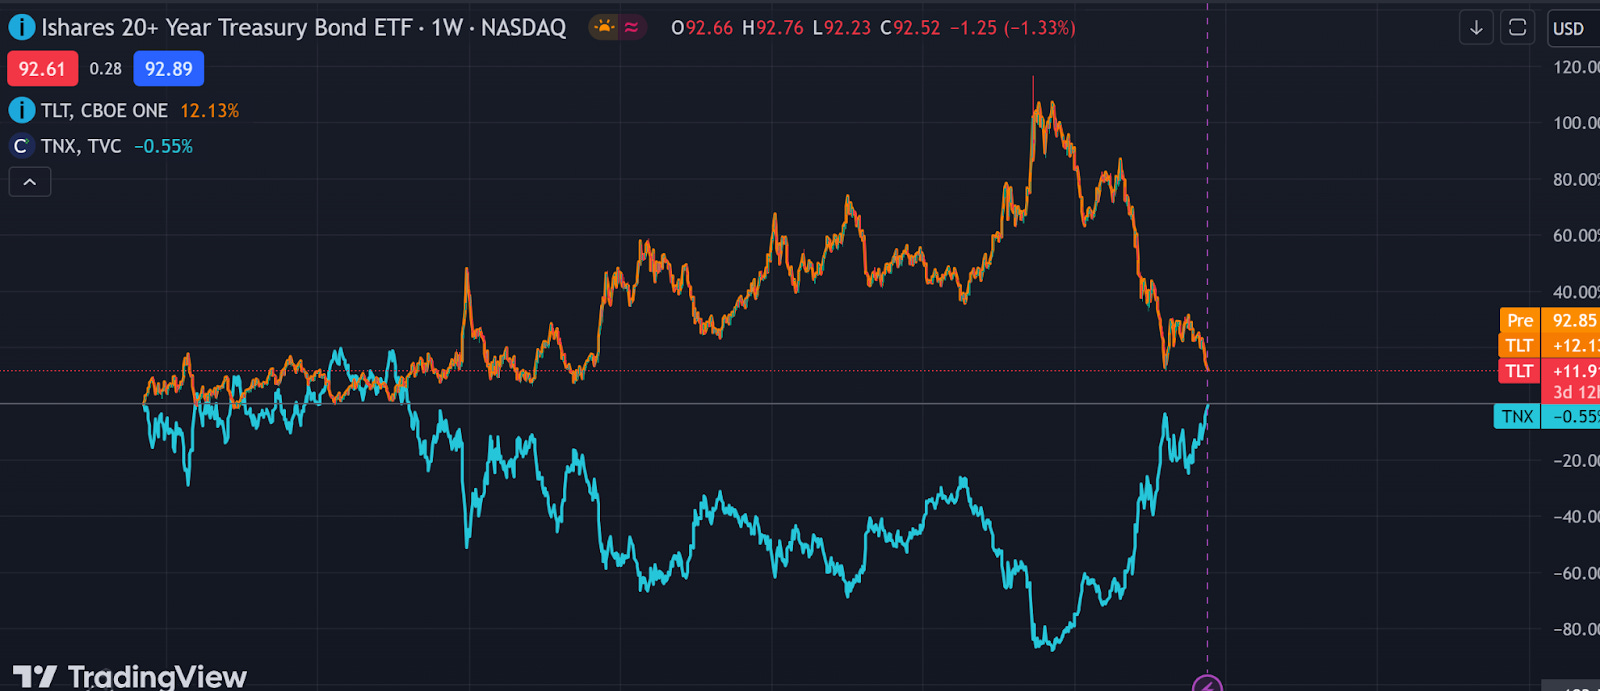
You can see that they are VERY inversely correlated.
The next part is a little wacky.
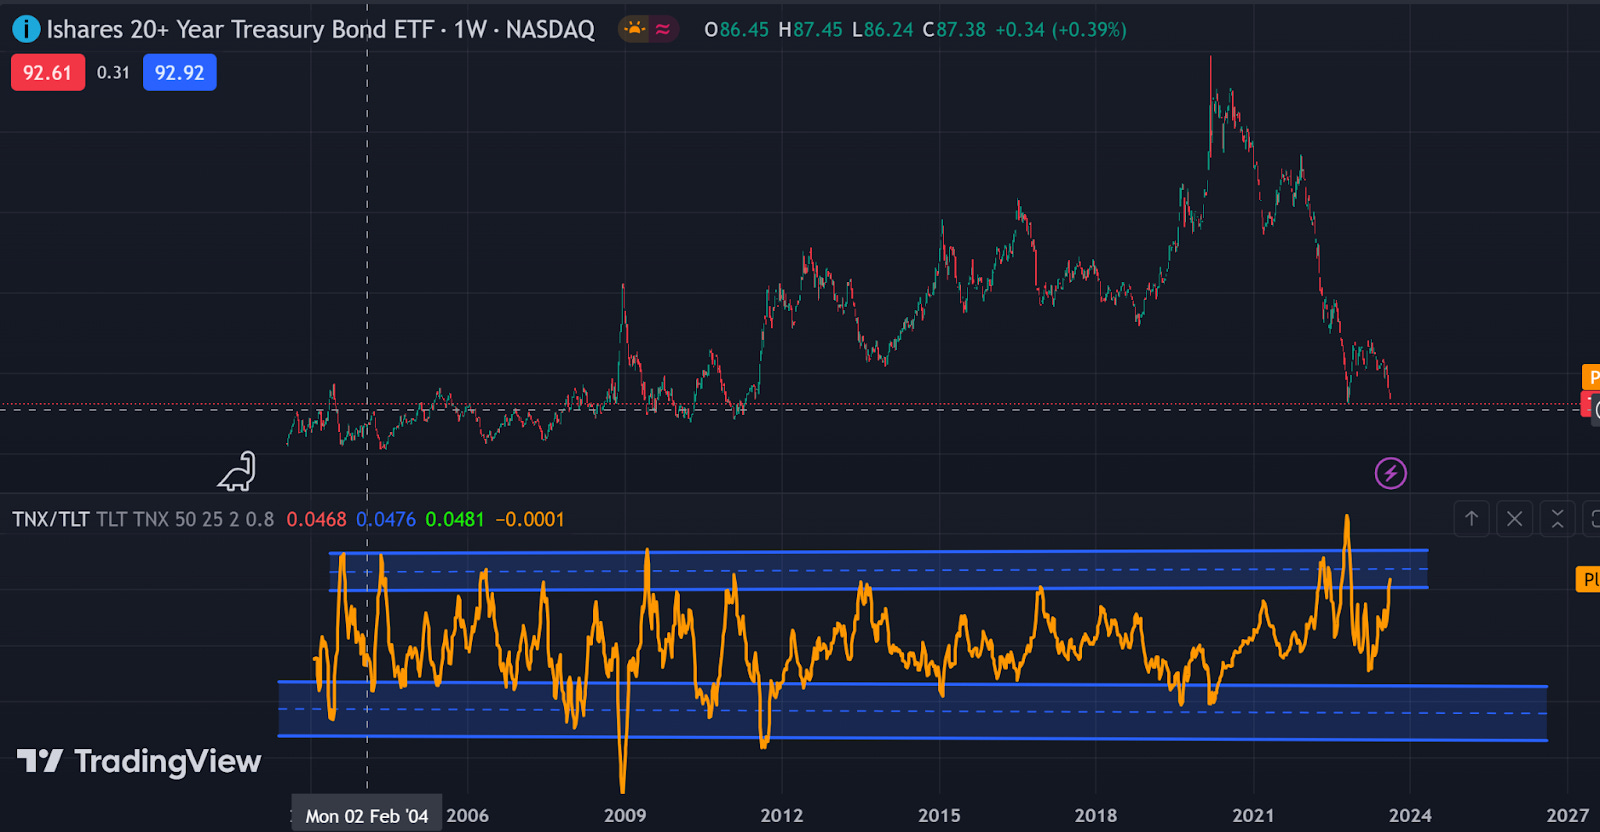
I don’t know which of my stupid-ass brain cells thought of this, but I decided to see if there is something interesting in the slope(derivatives … not the financial kind, but the calculus kind) of the 25-day moving average of the ratio between TLT and TNX.
Yeah … very random, but when I plotted it:
SHITTTT
Honestly, it was very surprising to me that I found something that looks like a pattern.
The yellow line is not TNX/TLT for each week’s close, but instead the slope of 25-day moving average of the ratio between TNX and TLT.
The interesting thing is … whenever the yellow line enters the top channel, it lingers a bit, and starts descending to the bottom channel.
During this descent, almost always, you can see a pretty big pump in TLT.
And, whenever the yellow line enters the bottom channel, it stays there for a while, and when it starts ascending to the top channel, we can see that the TLT enters a decline.
This is what I meant when I said that this is an unconventional method of technical analysis … We are literally applying principles of support and resistance to a fuking derivative (well, slope of a curved line).
Betting on an increase in TLT is a high-conviction trade because:
1) Price is near a support level, and I think we are due for a bounce
2) Yellow line is in the top channel, and I would hit the buy order for TLT the moment the Yellow line starts descending and leaves the top channel.
I also have a low conviction bearish case on S&P:
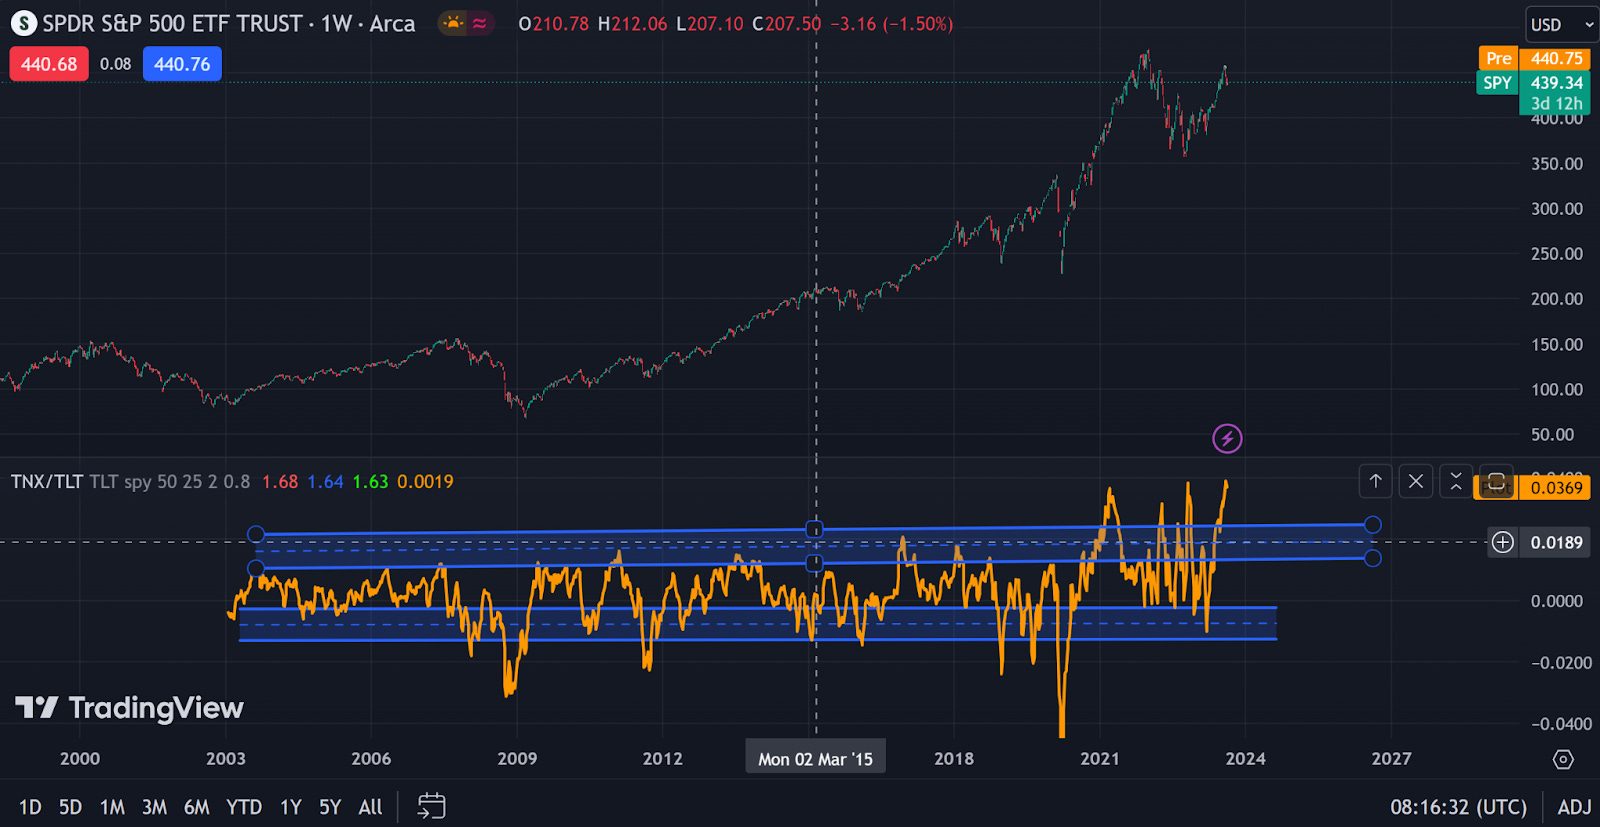
I did the same thing as above, but here, the yellow line is the slope of the 25 day moving average of the ratio between TLT and SPY.
We can observe the same exact thing … A Market declines whenever the yellow line is descending, and a rally when the yellow line is ascending.
But, at the moment, the Yellow line is a bit too much higher than the channel, but we can see a mini resistance level formed from 2021 to 2023.
If I were to short the S&P:
1) I would sell when the Yellow line is in a descent, maybe if it dips below the top blue line of the upper channel.
2) I would also short the S&P because I wrote about a high-conviction buy-case of TLT, and we know that TLT and SPY(S&P) are inversely correlated.
I hope to do more with this slope technical analysis thing.
I have plans for upcoming writeups using the same method for some other markets.
A few inspirations that made me think about TLT, TNX, and SPY: