

A lookback to a period of my shitty portfolio performance
A small synopsis of my unique lens-based approach
My forgotten child playbook
My Income statement value playbook
Technical Analysis: How I decide when to buy or trim positions
How you can morph my philosophy to suit your own needs
A quick example of combining my frameworks to come up with a company rating and decision. Ticker: EXFY
Ragnarok Research’s actionable idea!!!(Just to be clear, this is just an example name I am yet to do hard rigorous due diligence on, but definitely passes some of the things I look for in a trade)
The important of having an investment philosophy is cannot be understated.
When I just first started out with investing, I was all over the place. I mean, my entire due diligence process before I invested into any company was just a quick google search of what they do, and another google search of whether that particular industry is expending. Simple, eh?
Well, that did not work very well for my portfolio
One of my favourite cautionary tales of all time, is when I bought two stocks back-to-back: SONM, and MSW.
I bought SONM after about 2 minutes of due diligence: Someone had given a takeout offer at a huge premium, and the the stock wasn’t trading close to it. Thus, I bought. NO more due diligence there. I then bought MSW because … well… bitcoin treasury was announced. Here is what happened
Those two trades made me lose a thousand Danish kroner from my portfolio… while my portfolio value as a whole was about 8,000 Danish kroner. Double digit % loss!
And this certainly wasn’t the only time. I would read a twitter thread somewhere, get hyped, and go out and buy without doing a shred of due diligence about the stock.
Value investing ?? What’s that ? I’d rather buy near-bankrupt Chinese scams which just announced a bitcoin treasury!
I think these two trades were the catalyst in really formulating a process investment protocol to follow. Watching my portfolio bleed money every single day was painful as heck, and by studying a few successful trades both online and in my own portfolio in the past(but alas, these were sized in a very small allocation) and finally somehow pulled off a semi-turnaround, growing my account size by about 30% since April:
Sure, SPY is up double digits since April too, and it can be argued that it is levered beta, but still a vast improvement from the depressing double digit % loss from the months prior. All the ‘success‘ in the portfolio after the month of April, in my opinion, is setting some good rules and ‘frameworks’ to follow, if it makes sense.
My Framework-lens based approach
The way I view investing, is that it’s an art. It’s subjective. In fact that’s why the markets are not efficient giving us exploitable opportunities. But when I say ‘frameworks’, I mean it in a way that I like to put on different lenses when I look at different companies.
For example, take Transmedics Inc (TMDX):
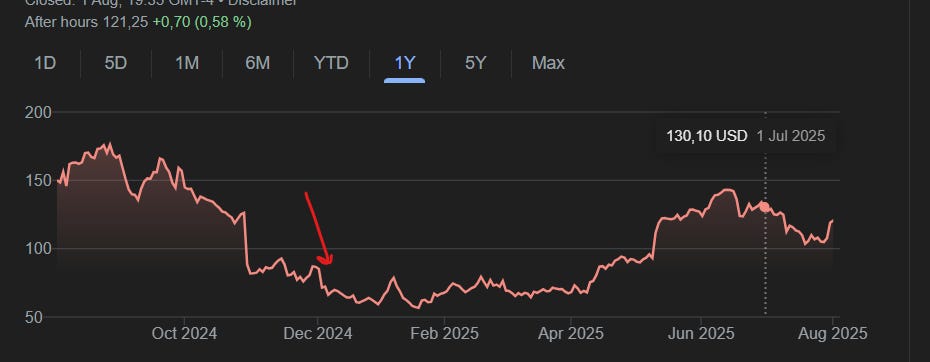
TMDX, at the time when the red arrow mark was drawn, was trading at a Price-To-Earnings ratio of about 40-60x. Price to FcF was at a similar range as well.
Now, would any strict value investor buy something trading at those valuations ? Most probably not, since they’re too used to companies trading at 2x PE or whatever.
However for a growth investor, that price was a dream. This thing was growing at double digit percentages and was trading at such a low price due to ONE disappointing quarter.
This is the crux of the way I view trading: Not every stock will appeal to every ‘lens’. Something that may be liked by a growth investor might be shunned by a value investor. My investment philosophy is to invest in a company where the combined appeal in the stock seen through one or more lenses is outrageous.
What does this mean? Here is how I’d better put it:
When TMDX was trading at about the 60s, the appeal in the ‘growth’ lens was immensely, outrageously high due to flight tracking showing that the disappointing Q3 earnings was just a blip, and growth was bigger than ever. However, the ‘cheapness’ lens’ appeal was little low-to-mid, with the PE and Price to FcF ratios being mid double digits (albeit they recently turned profitable so wouldn’t punish that too much). So, at a price of 60$ per share, the value in the ‘growth‘ lens was so high for me, that it was enough to counteract with the ‘meh‘ value in the cheapness lens. So, I bought!
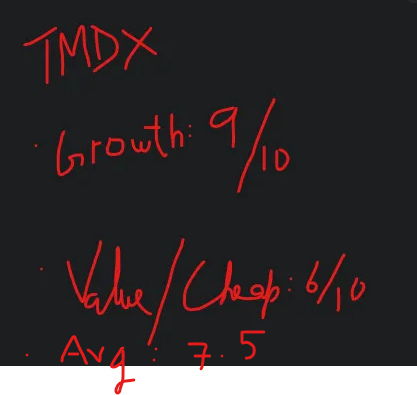
Maybe this is a form of factor investing, I am not really sure. But the overall goal for me is to either find huge amounts of ‘value‘ in one lens (such as growth lens, cheapness lens, capital allocation lens, etc) enough to compensate for the sort of ‘red flags’ that may arise from the other lenses(say a really high PE ratio, etc) OR find small fragments of value in different lenses and when they add up, they make a decent investment
The list of lenses I take into account while looking for value/appeal in a company
For those who don’t really get why I call them ‘lenses’, imagine this. When it’s hot, you wear shades. But when you’re in front of your screen, you probably wear blue-light glasses. Point is, you change what lens you wear depending on what’s front of you.
Similarly, I try to look at companies in different perspectives. Is this a grower ? Is it a company in the stage of returning capital ?
- The Capital allocation lens. I call it the ‘forgotten child playbook‘. TLDR; ‘Balance Sheet Value‘
Terribly sorry if the mini-title spurs up some childhood trauma you guys might be harbouring, but I call this the forgotten child playbook, because my favourite type of companies to look at, are castaways. Maybe they screwed up a little before, and the market punished them to Kingdom Come, and now trade at absurdly cheap valuations.
However, that’s not all. A shit ton of companies fit that category. What I like to see, is that the company clearly trading at a discount to fair value, and the management team closing that valuation gap via buybacks/dividends, etc. I simply love cases like this and these are my favourite type of trades. I know the mini-title says ‘Balance Sheet Value’, but in reality it should be ‘Balance Sheet Value being returned to shareholders’!
Now, it is important to me that these buybacks or value-generating moves are not ill-timed. For example, take a look at INMD:
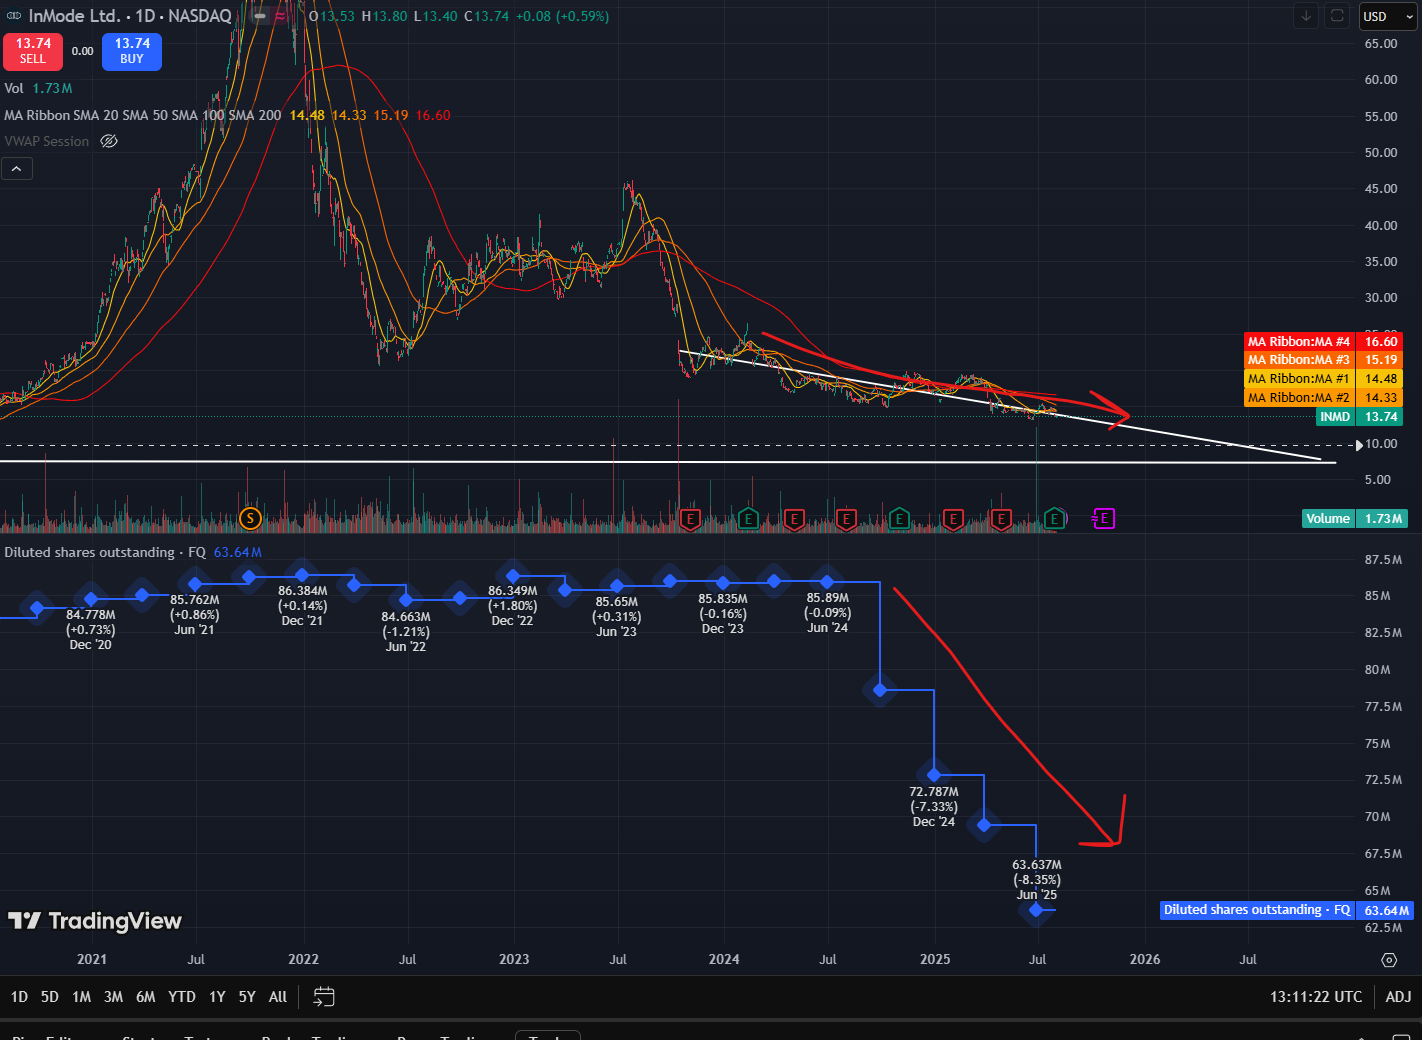
Management repurchased a boatload of shares… but the only thing that was faster at reduction than the share count, was the share price (boom). I know a lot of people have different reasons, such as INMD’s growth prospects becoming grimmer by the day, but INMD executed these buybacks at a time when INMD’s balance sheet contained 720 million dollars in cash, and about 110 million dollars in liabilities. ‘Net cash‘ works out to be about 610 million dollars.
The market cap was about 1.5 billion dollars.
See what I mean ? Why would buybacks work in this scenario when:
Prospects of income statement growth are deteriorating
The company trades at a 2x premium to net cash ?
If INMD was trading about, say 60% lower, that would be no-brainer level of buying price, because this is where buybacks can help the most.
An example of where buybacks went right is MOMO. (Shoutout Cluseau for the trade idea. Link here)
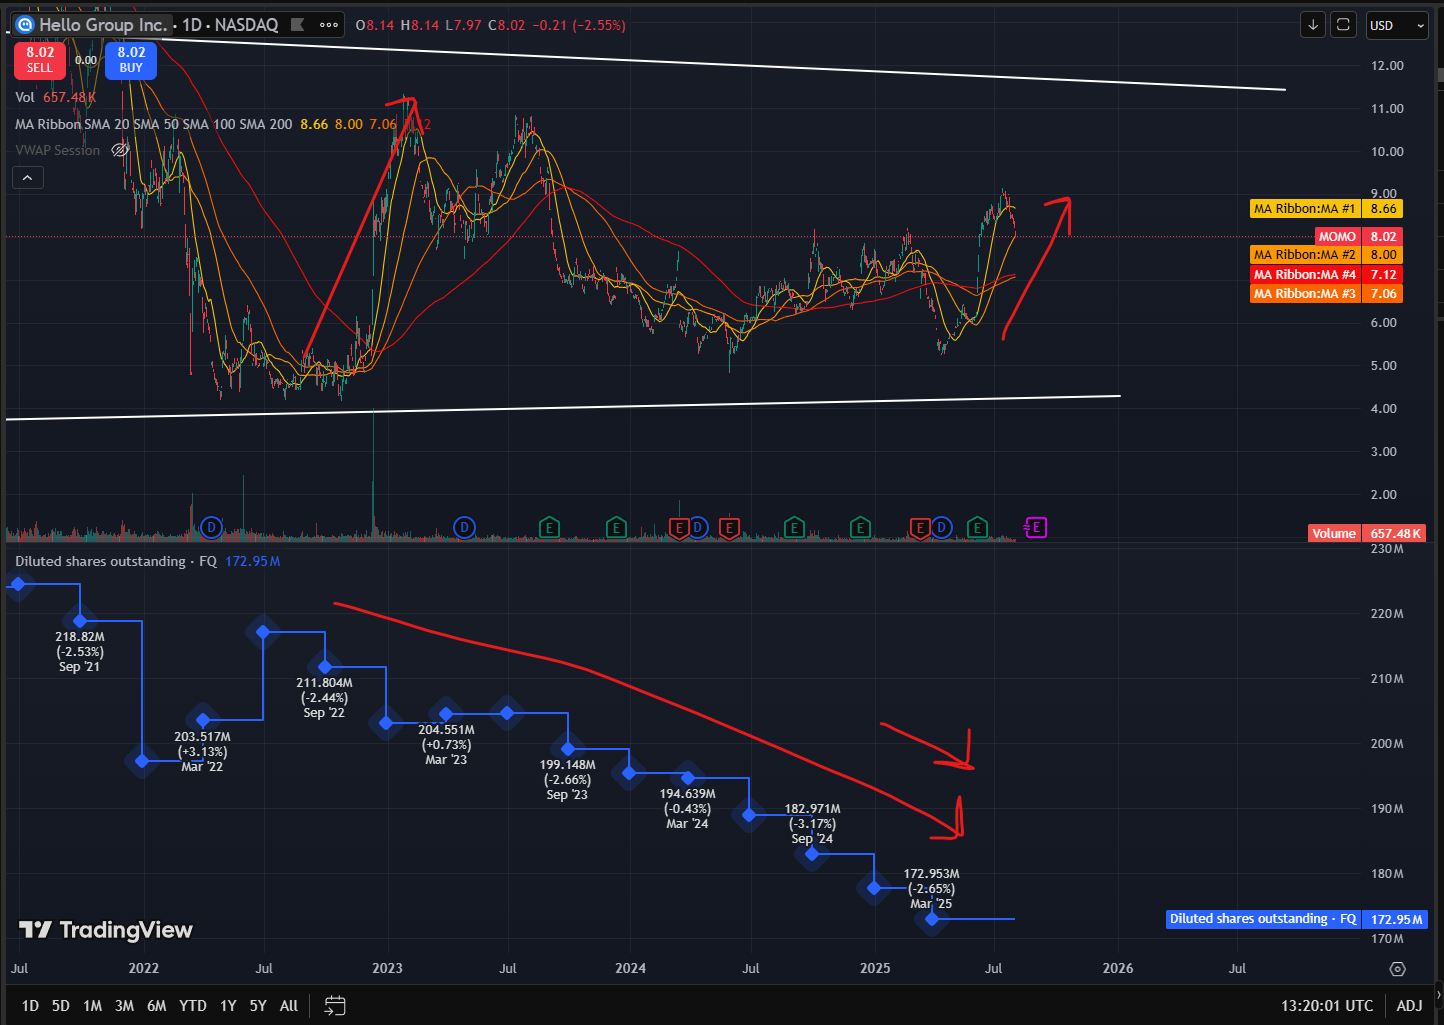
Notice where I have drawn the arrows ? At the times when the base of the arrow starts, these were the stats of MOMO:
Arrow one: Market cap was 850 million dollars. 1.5 Billion cash, 700 million liabilities. Net cash: 800 million dollars
Arrow two: Market cap was 880 million dollars. 1.2 Billion cash, 750 million liabilities: Net cash: 450 million dollars
Do you see the vision ? When net cash balance is a huge % of market cap AND Buybacks are happening, magic can take place :) Of course, timing is much, much harder than I made it seem, but the overall summary is that I like buybacks, only when they are executed while closing a valuation gap, not when the stock is trading at an absurd premium to its balance sheet. Of course, this ‘capital allocation’ lens is not the only component in making an investment decision, but for me it is a major part!
How do I decide when the value proposition of the ‘forgotten child’ element is not high enough? Easy! Just track net cash value relative to market cap!
Now suppose you bought a stock, such as MOMO and you are happy with it. Hypothetically, let’s say at the time you bought it, Market cap was 850 million dollars. 1.5 Billion cash, 700 million liabilities. Net cash: 800 million dollars. However, what happens when the stock actually starts rising ?
The same way I like to rate the ‘value’ propositions form each of my lenses before deciding whether to invest, I like do this every week or so for my holdings. For example(hypothetical figures):
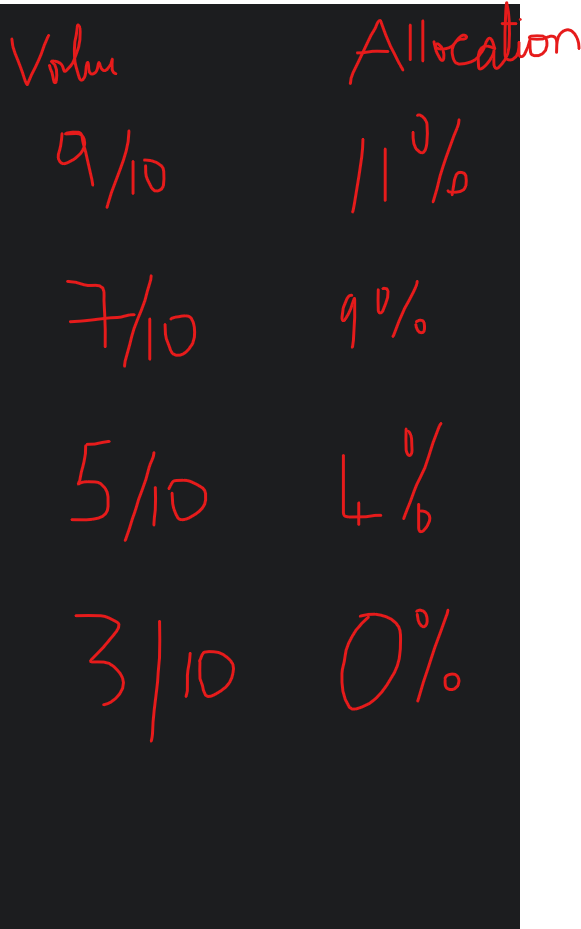
Week 1: MOMO market cap is 6% premium to net cash. Balance sheet value: 9/10 Week 2: MOMO market cap is 10% premium to net cash: Balance sheet value: 8.6/10
Week 3: MOMO market cap is 20% premium to net cash: Balance sheet value: 6/10
See what I mean ? The more and more the company’s balance sheet value deteriorates(net cash as % of market cap), the risk to reward from a forgotten child-esque lens decreases, and so does my portfolio allocation of MOMO along with this score(well, I change my portfolio allocation using an overall figure with all the lenses added, not just the capital allocation lens)
- ‘The income statement value’ lens. I do not have a clever tagline for this framework unfortunately. TLDR; ‘Can the company grow its revenues and net income better than market expectations ?‘
Now let’s remove our capital allocation glasses, and put on our growth glasses. I think this is the framework most of us grew up with. ‘Buy cheap companies with low PE ratios’. Bleh. What fun is that ? I think that is actually the best way to underperform since you’d probably end up buying value traps(unless company is trading at a balance sheet discount and is repurchasing shares lol)
My personal definition of income statement value is to see whether the realised revenue growth in a company can be more than what the market is expecting. I attempt to gauge market expectations by looking what sell-side investment banks say, and what fintwit or just the investment community in general says, paired with the usual PE and PS ratios. The two internal devices I absolutely love using under the income statement value lens are:
Information arbitrage(insider tradi- I mean, doing more due diligence than the other guy)
Time arbitrage(Just being patient … aka not look at my portfolio because I don’t like the color red)
I still think that my finest information arbitrage till date was TMDX by tracking the flights that they did and coming to the conclusion that growth had NOT stopped. My writeup can be read here. Sure, the thing was not objectively cheap, but when I bought TMDX, it was trading at a price-to-sales ratio of about 5x. That number is very cheap for a company which I thought would grow mid-to-high double digit percentage. This is the essence of income statement value investing. Investment banks all over were screeching about growth stalling and Fintwit was a mess. But all you had to do, was look at the data :), and you’d see that the relatively-low PS ratio was a testament of the market undervaluing TMDX!
Now Time arbitrage requires some balls. It’s basically just being patient, and hoping that a company’s current situation slightly improves going forward. I see this in a lot of retail names. Look at GAP for example:
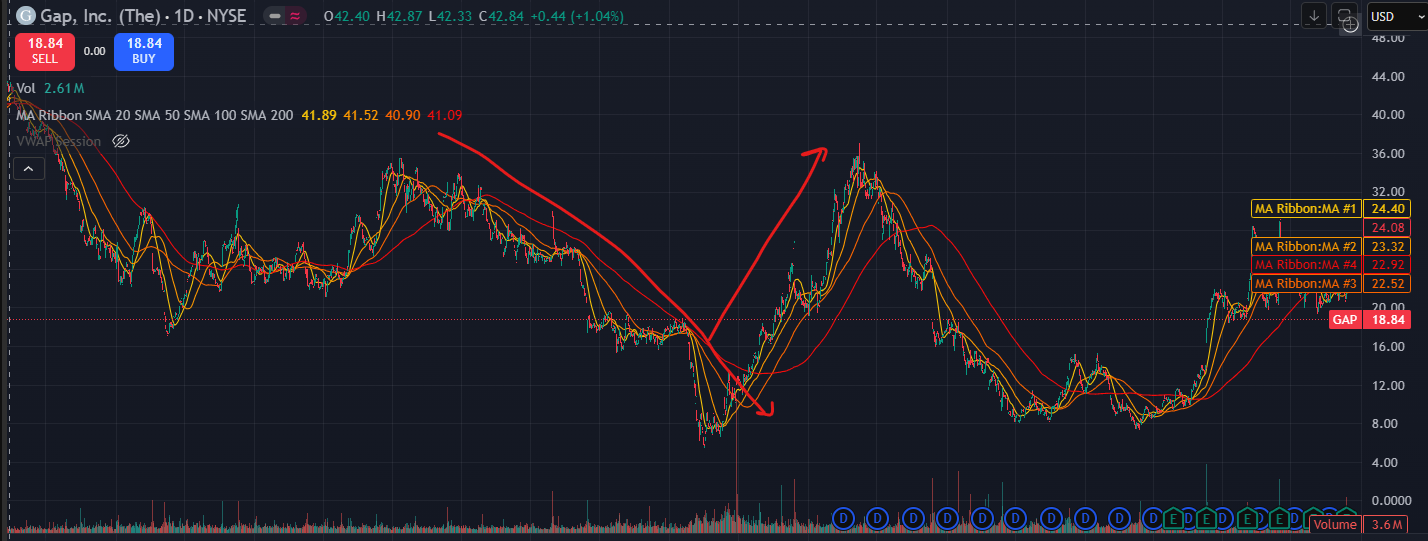
GAP fell from about 35 dollars pre-covid era, to about just 5 dollars during covid. In retrospect, sure it was an easy enough decision to buy consumer names. However the essence of income statement value lens, is constantly asking yourself ‘What does the market think will happen to future revenues, and is that what I think will actually happen ?’
For context, this was how the revenues looked:
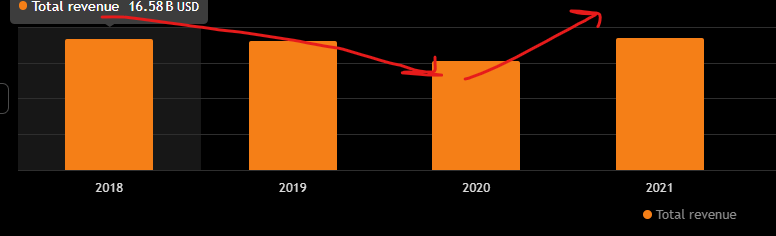
The market saw GAP’s low revenues in 2020 and decided to linearly forecast it into the future as if the trend would continue. However, it didn’t :)
The market always, in my personal opinion, tends to extrapolate shitty situations into the future, and it is the investor’s job to look at what the market is signalling about the future, and then make a decision.
One of my favourite subsets of income statement value investing in derivatives of megatrend, and I think the market for a good while awards opportunistic investors with companies priced for ‘meh‘ growth, but will capitalise hugely. Here’s an example:
The big latest megatrend: Artificial Intelligence.
What were the obvious trades ? Well, MSFT, Nvidia obviously. So this is the first derivative. But what about the second derivative ? In my opinion, this can be found by following the money. The hyperscalers were pouring huge amounts of capex into data centers. So, PSIX was a pick:
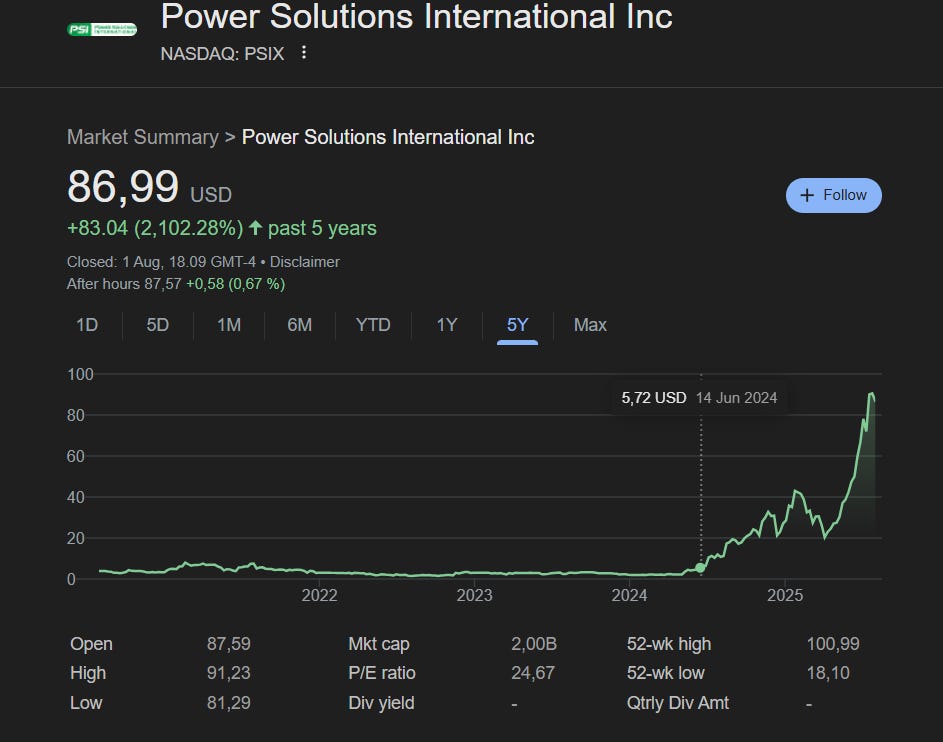
Now, similar to the forgotten-child-lens playbook, I constantly try revising my ‘income statement value’ rating whenever the stock’s fundamentals or the stock’s price change in a material way. A 6x PE stock which I forecast will grow 10% does not deserve the same allocation if it becomes a 20x PE stock forecasted 10% growth. Point is MY quantification of income statement value is a marriage between my forward looking analysis, and the present day perception
When do I pull the buy-trigger ?
They say technical analysis is astrology for men. And I agree. But unfortunately, the cases where I have ignored technicals has cost me dearly. I know your usual trading guru would talk about the ‘Dinosaur tail cup and handle‘ pattern, but I prefer to be a little simpler. Here is all I pay attention to:
Key moving averages on the daily, weekly, and monthly charts (20, 50, 100, 200)
Support and Resistances.
I try to overlay my fundamental approach with technical analysis without fail. I would never buy a name without it being both technically and fundamentally sound. I don’t exactly believe that the secret to outperformance is hidden in the charts themselves, but I think price is the most powerful signal of all, and I always want to follow the money.
Now, I employ different types of technical analysis to different types of investment theses, with most of these theories inspired by James Bulltard. For instance, when I want to take a fairly contrarian position, like how I did in TMDX, I feel comfortable with confirmation in the monthly and/or the weekly charts. And that is what I had:
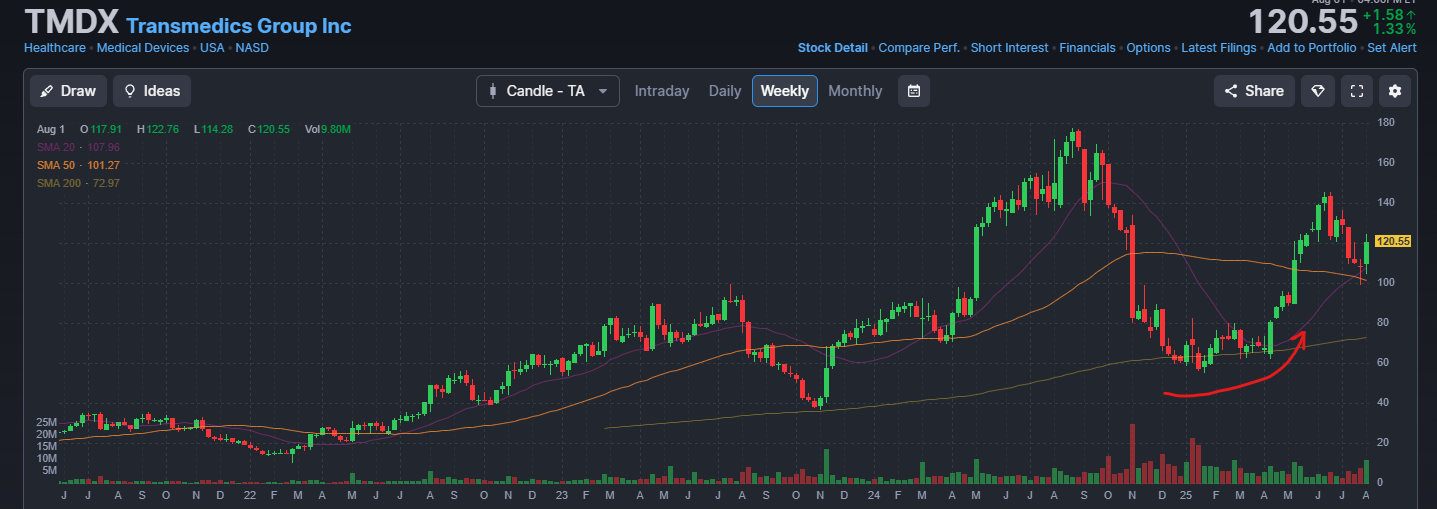
On the weekly chart, TMDX was grazing beautifully over the 200 SMA curve. For contrarian positions, I make it a point to buy (provided I have strong fundamental conviction) when the price is on either the 20, 50, 100, or 200 Moving averages, on either of the timeframes (daily, weekly, or monthly. I like weekly and monthly best).
Now look at the monthly chart of UNH:
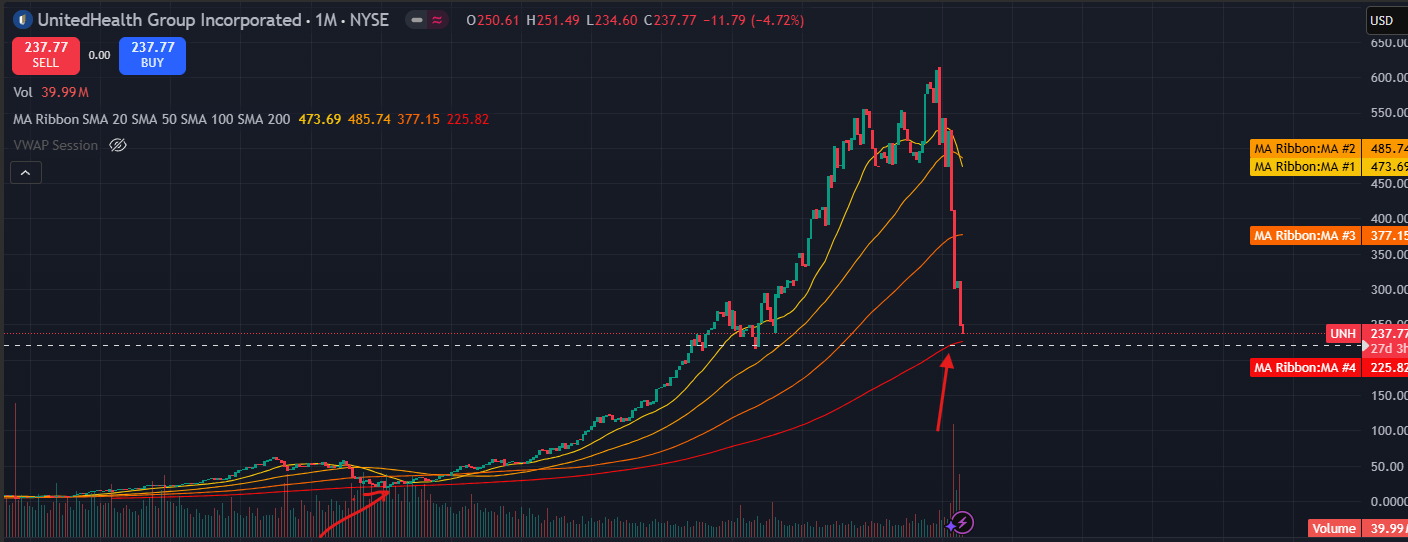
We all know about the shitshow going on at UNH. But the last time it grazed the 200 month moving average was back in 2008, a terrible year for everyone, the stock obeyed the 200 monthly moving average as a beautiful support level, and that is what I suspect will happen now. I don’t have fundamental conviction on UNH yet because I haven’t dug deep into it, so I wouldn’t buy it yet.
For slightly more ‘laid-back’ positions, as in where the stock is already going up but I think it has more room to go up, I like to buy on temporary weaknesses. Look at MKTW for example:
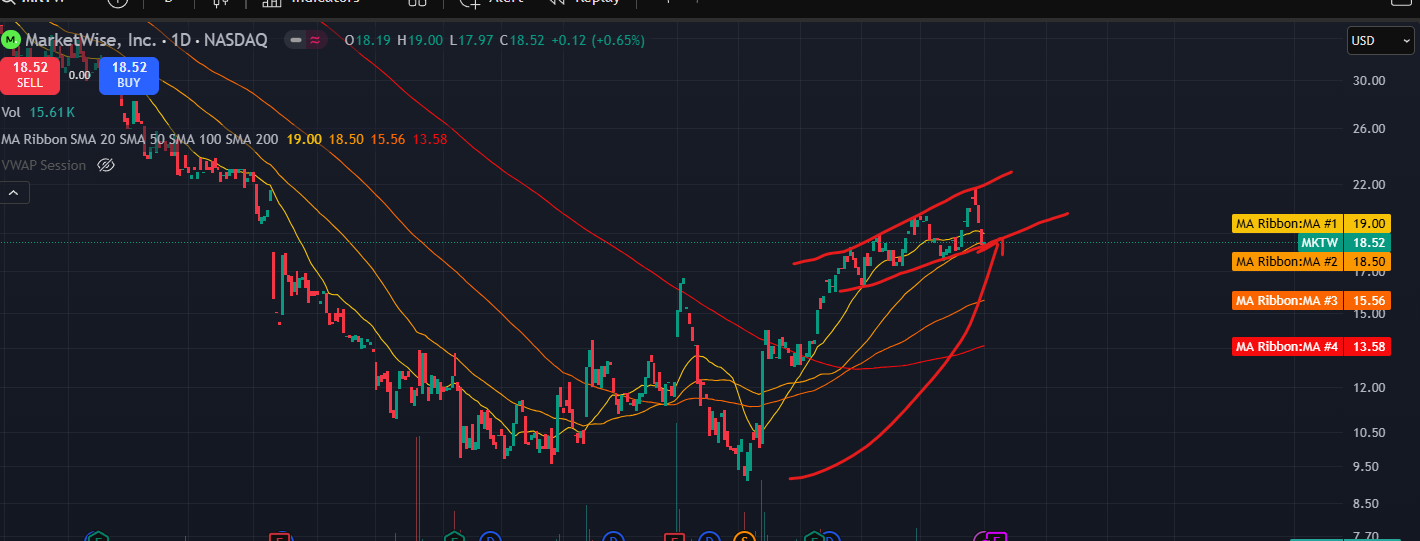
I like the stock due to the fact that I think it is turning around successfully. But besides that, now would be a great time to buy (I sized here very recently) because the price is touching the 50-day moving average and also is at a support level in the channel that I have drawn. However, the moment the stock starts breaking down below the moving averages, I would either slash my position by a big %, or sell all my holdings temporarily. Now, moving on to one of my favourite technical cases to analyse: PYPL
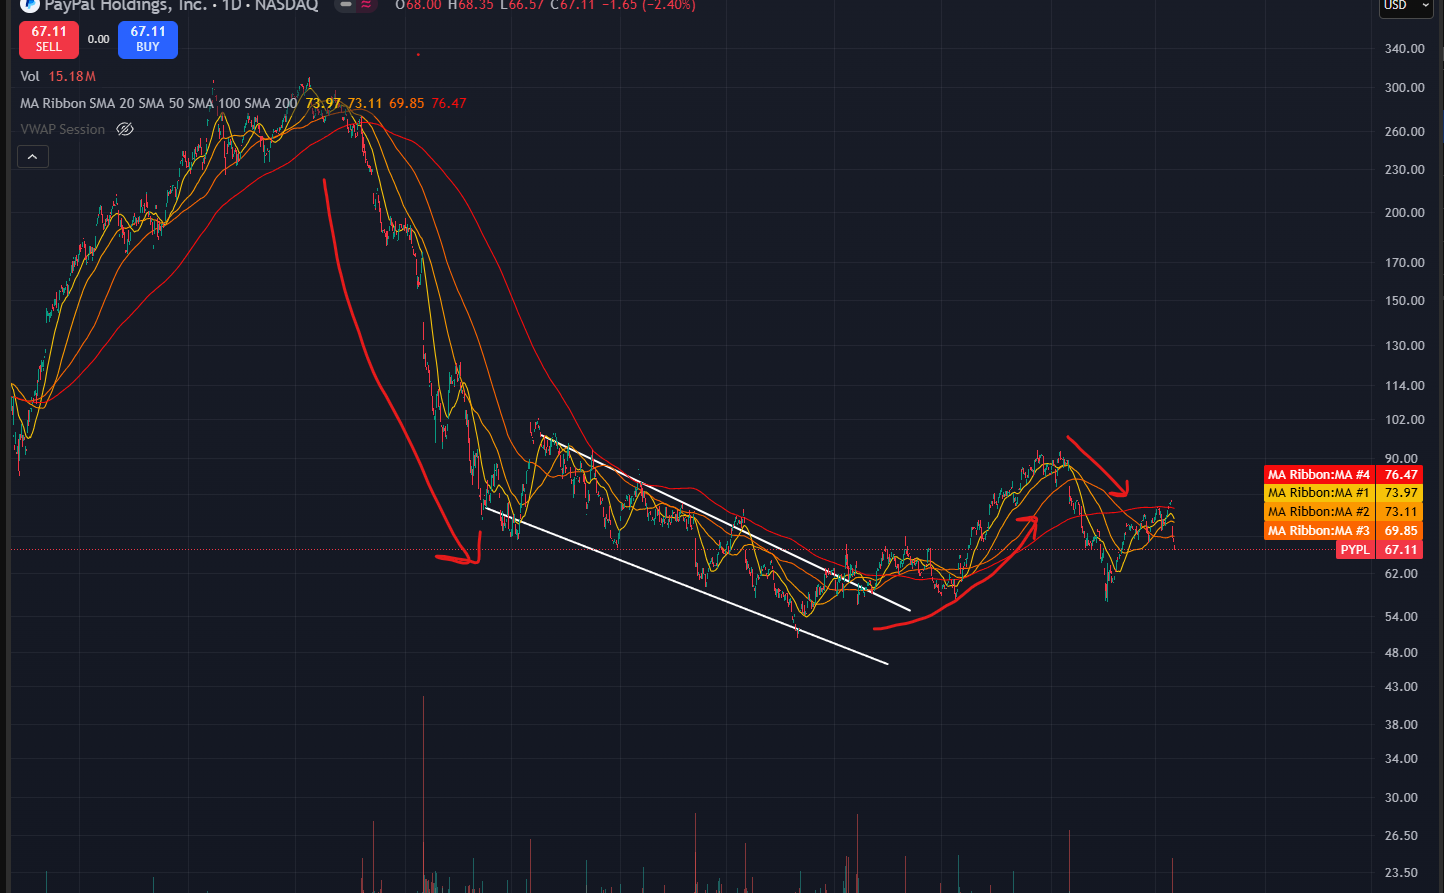
I think that this is a great showcase of how in an ideal world, I would want to manage risk. First off, when PYPL was at all time highs, it started to have a breakdown. Notice how it didn’t really bounce off of any of the key moving averages. The moment something breaks below a moving average, I would de-risk that position because in the moment, I would have lost any technical conviction I might have had. And besides, PYPL was trading at 60x PE… Yeugh.
Another instance of ta good trend-based technical position is the following,, ticker:VRT:
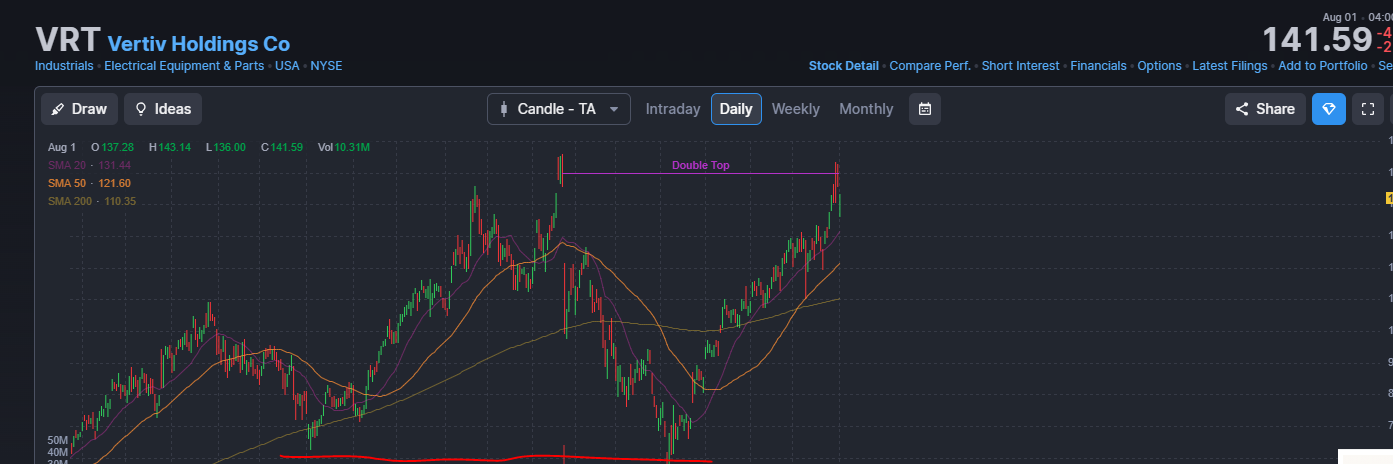
Massive support level, and price blistering through the 20 and 50 day moving averages was a great thing to watch.
Either way, notice the deadly downtrend marked by the white channels(back to PYPL again) ? If I for whatever reason were to have fundamental conviction on the name, I’d buy whenever the stock reaches the support level. This way, in hindsight, I may have made some money even! However the real meatish play, is the mini turnaround. The way I like to trade stocks emerging from multi-year lows is to buy when a golden cross occurs, that is, the 20 day moving average crossing the 50 day moving average:
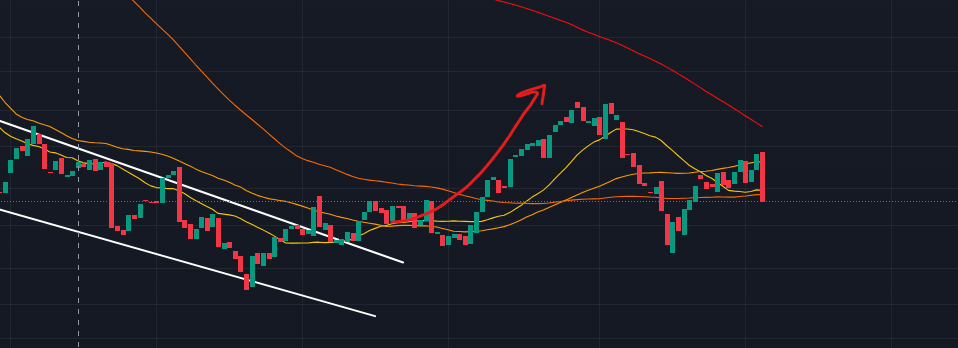
Notice how when the price and also the 20 day moving average went above the 50 day moving average, we had a mini rally? That is what I aim to capture in names like PYPL(Given I have enough conviction in fundamental growth)
But again, notice how the price then breaks down after the mini-rally ? Now depending on how risk-averse I feel, what I feel like I would do is try to size up in each of the moving averages, but immediately cut my positions when the price crosses below the moving averages, because a break in trend of any kind (be in moving average, or a trendline), is an immediate no for me. I am always happy to give up small bits and pieces of gains to wait for technical confirmation, since that is where my risk management technique lies. The moment something closes below the key moving averages on either of the timeframes, I take time to re evaluate the fundamental thesis, and decide how much of the position I want to slash.
If I have decided to buy a stock for a short term position, it dipping below the 20 day moving average is a warning sign for me that something is breaking down, and it is a reminder for me to re evaluate the fundamental thesis again. However, if technicals improve, always get back into the position if the fundamentals still are good! One of my worst trades is EVLV:
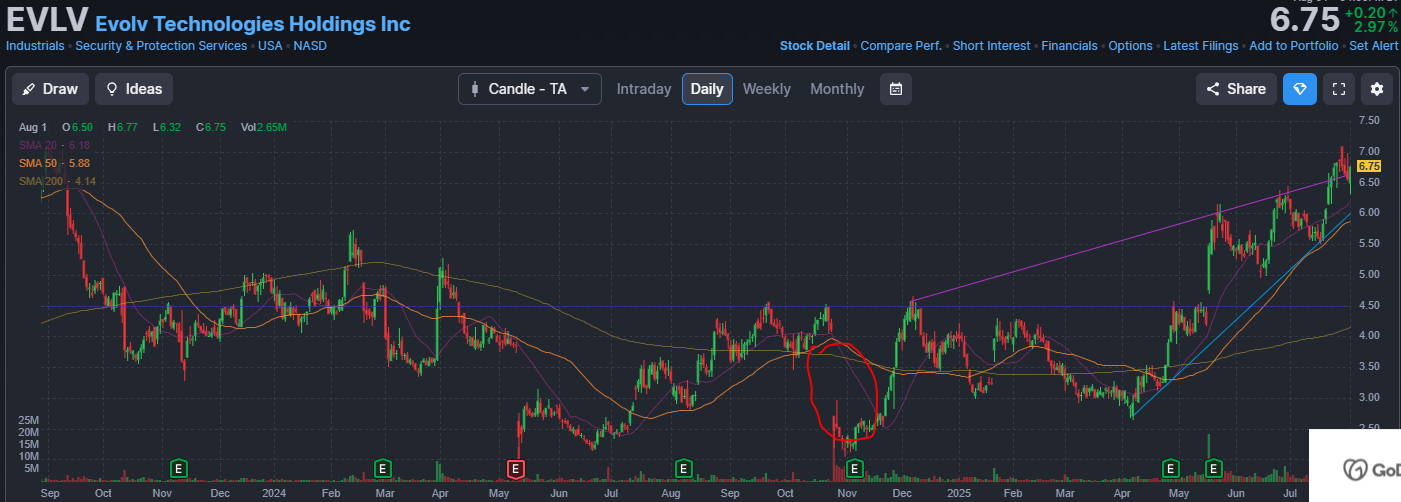
The stock well from 4$ a share to about 2.5$ a share in a few days due to fraud allegations. But even if they were true, only a small % of revenues were ‘fake‘. So, I bought some. However, I set such a tight stop loss (about 10%), that I got stopped out, and discarded it from my watchlist. But notice how the name rallied above the 20 day moving average, and then increased about 100% from that point ? Yeah…. pain. Thats why I have always made a point to never discard names from watchlists … and this was especially painful because fundamentals were still sound!
Now, don’t get me wrong, If the fundamental thesis has been getting stronger and for whatever reason the market is still punishing the stock, I would wait until it kisses the 200 Simple moving averages to size up. However, the moment it crosses that on the weekly or monthly timeframe, I’m completely out.
Morphing my investment philosophy to your needs
Now, it is very possible that my so-called investment philosophy has got you nodding your head and get you thinking ‘This kid’s account is not surviving for more than a year’. And quite frankly, I wouldn’t be too surprised if it didn’t :)
But what I’m hoping to impart is my mental model. For me, I like to divide fundamental value into looking at a company with the capital allocator’s lens, and then the income statement value lens. Maybe that’s not what you pay attention to, but maybe you have something else!
I know a ton of investors who prefer companies re-investing profits back into the company instead of buybacks. I also know a ton of investors who like the thrill of buying pre-revenue companies. Well, take the factors that matter to you and try making a blend of your own ‘value‘ metric, and use that as a gauge of how much of the portfolio you want to allocate to a position, if at all!
One example of a custom lens-based framework would be a metric blending growth in gross margin (maybe you like companies becoming more cost-efficient), and reinvestments into the business ? It can be whatever you want! Point is, I heavily think that it is good to keep evaluating the ‘value‘ proposition in the stuff you care about, and trimming or increasing positions as this value changes as the price increases.
Tying it all together: A barebones analysis of EXFY, Expensify Inc, where I look at the company from both the income statement lens and capital allocation lens
1. EXFY: Expensify Inc
Expensify Inc became popular this year because it was the title sponsor of the fictional F1 team Apex GP in the movie ‘Formula 1’ starring Brad Pitt.
Now, let’s look at EXFY in the lens of capital allocators or Forgotten children(lol):
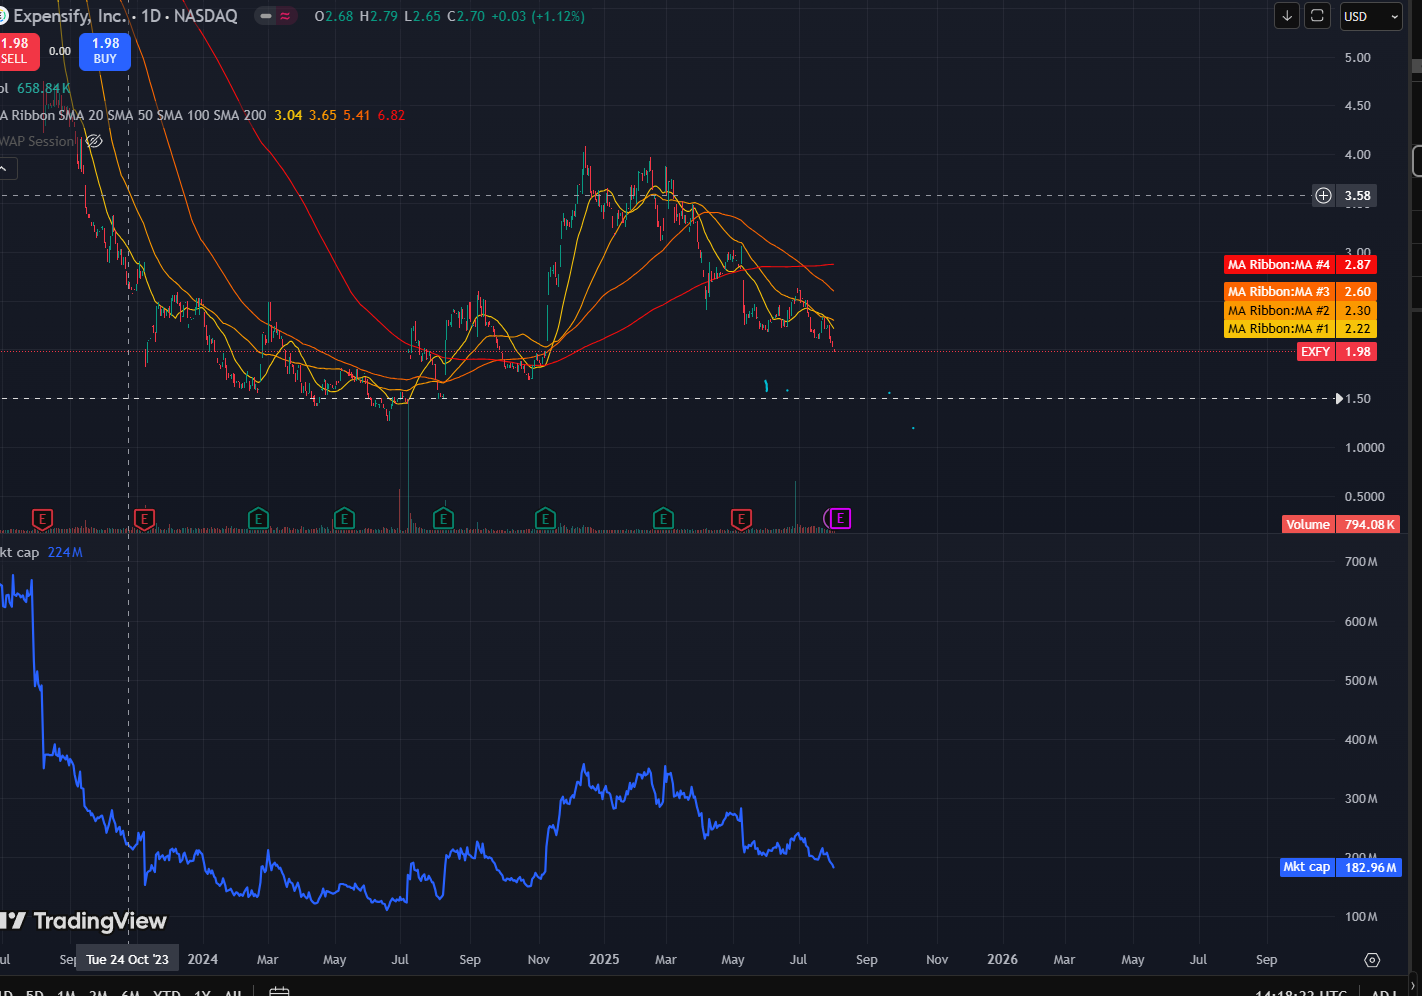
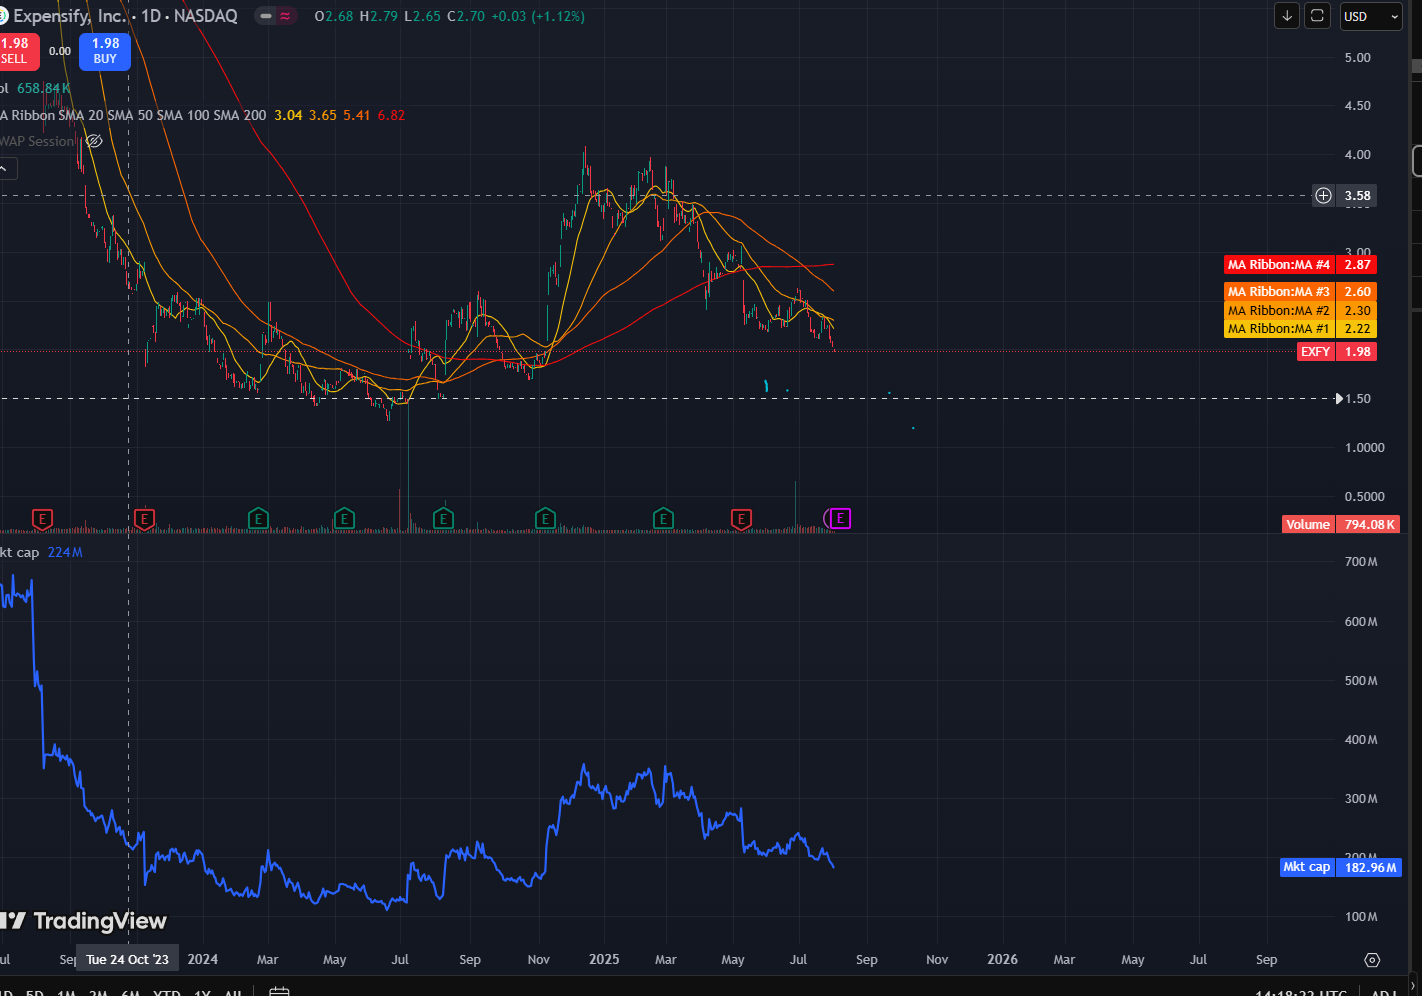
Market cap: 180 Million Dollars
Share price: 1.98$ a share
Effective ‘Net‘ Cash: 50 Million Dollars
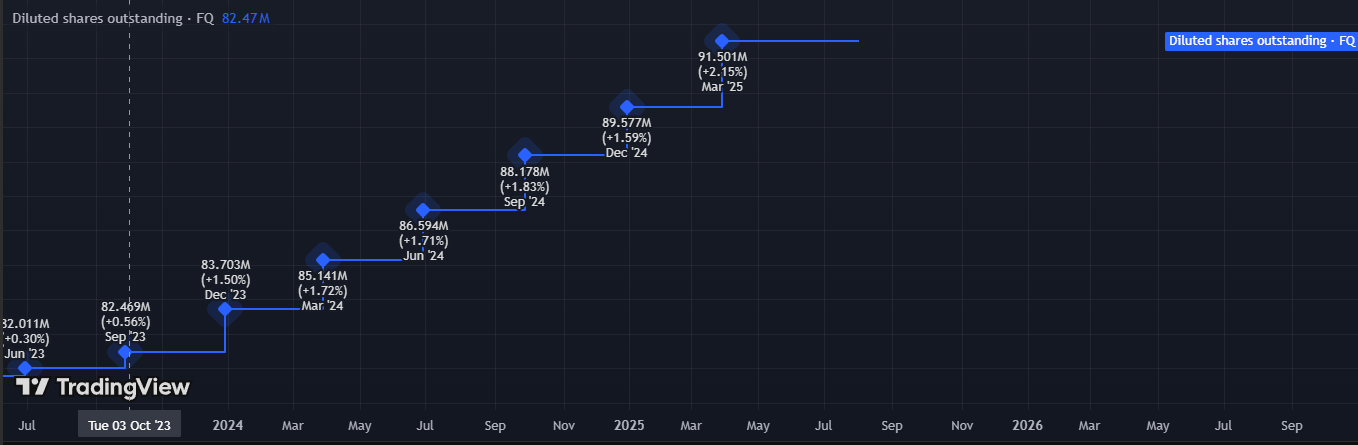
Share count: Increasing (bad):
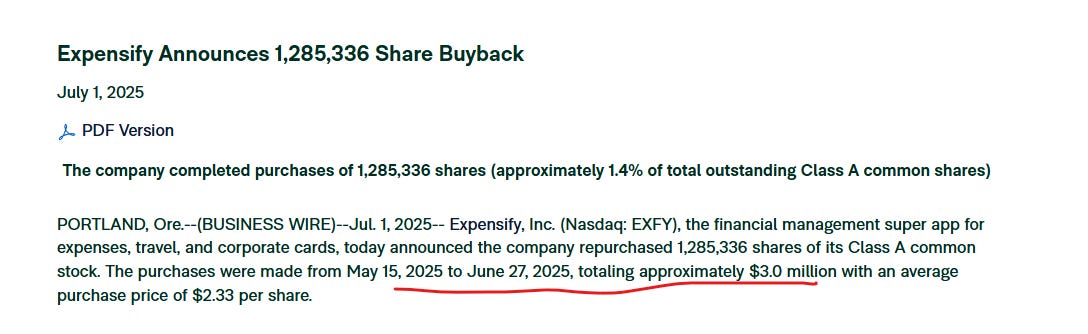
Buyback status: 3 million dollars repurchased at a price of 2.33$ per share(part of ongoing 50 million dollar buyback authorisation):
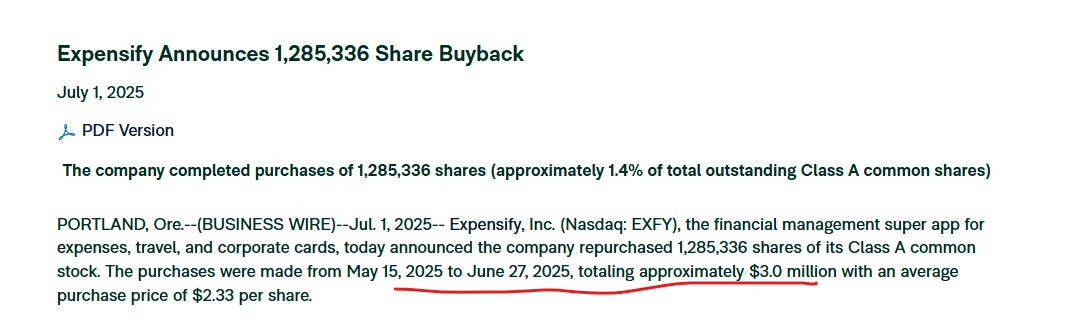
So, all in all, we have a pretty clean balance sheet … but shareholders are being diluted. But then again, seems like the company wants to mitigate this by buying back the shares, and now we have a chance to buy it at a price lower than the previous price at which management bought 3 million dollars worth of shares!
However the increasing share count ruins it for me. Balance sheet value: 6/10
Now, the income statement value:

I mean, it’s pretty flat, right ? Nothing special here. Although I think that there is a huge potential for improvement. So far, a scroll through reddit shows the following reviews about Expensify’s service:

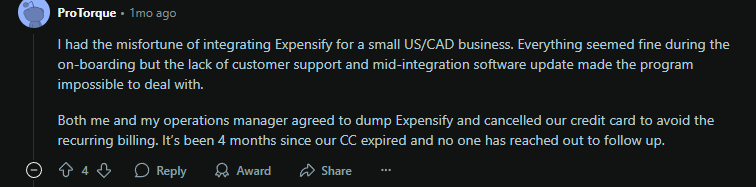
The worst part is I see a revenue cliff coming soon maybe:
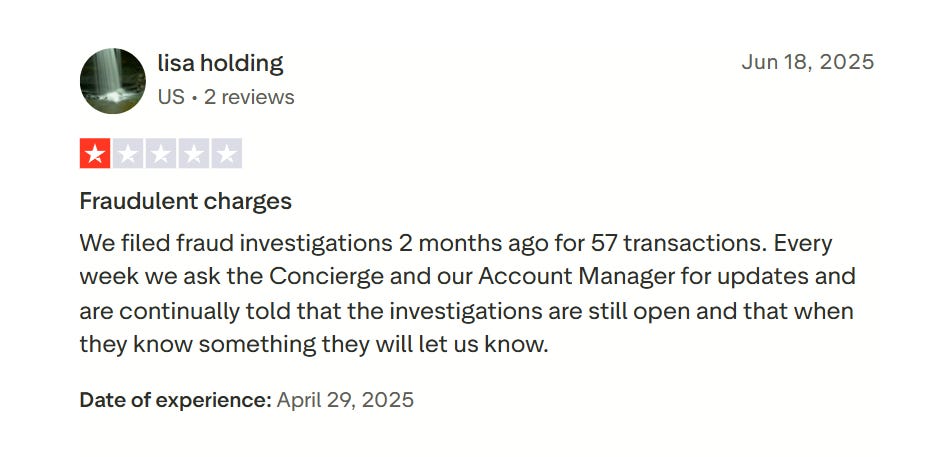
I see a lot of people who subscribed for a 12 month subscription coming off of their plans because EXFY does not allow cancellations of any kind:
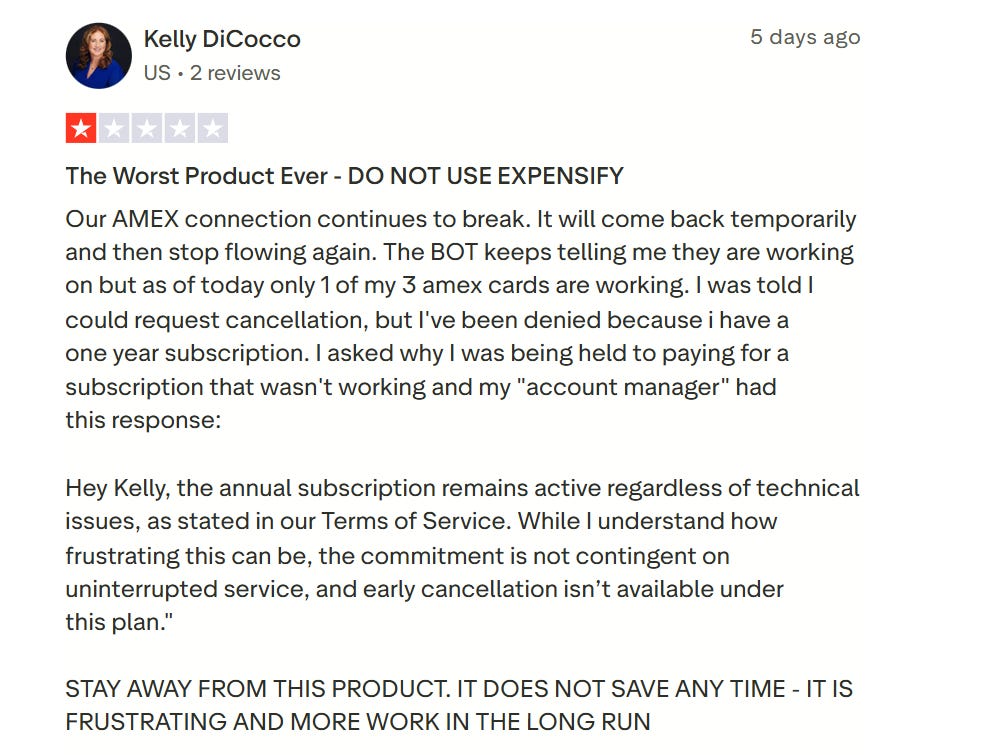
Now I know that every service will have customers that don’t like it but … meh the the magnitude of shitty reviews everywhere was abysmal. I asked someone in the industry and this is what I got:

Income statement value: 4/10. I don’t know maybe an activist can improve it and maybe the F1 movie gave it a little bit of a marketing boost but I don’t like the long term prospects
Verdict: 4/10 Income statement value + 6/10 Balance sheet value = 5/10 average.
My verdict is to put this bad boy on my watchlist, and wait until one of the value mines , be it income statement value or the balance sheet value, improves materially. For instance, if the company stops the bullshit dilution, I would bump up by forgotten-child-playbook rating from 5/10 to about 6/10, and if they either push harder on the buybacks (they technically should, since current price is lower than previous buyback avg price) or the price collapses by 50% somehow, I would hike my rating from 6/10 to about 8/10 in the capital allocation lens of the company!
Moreover, the technical chart of EXFY is not pretty at all:
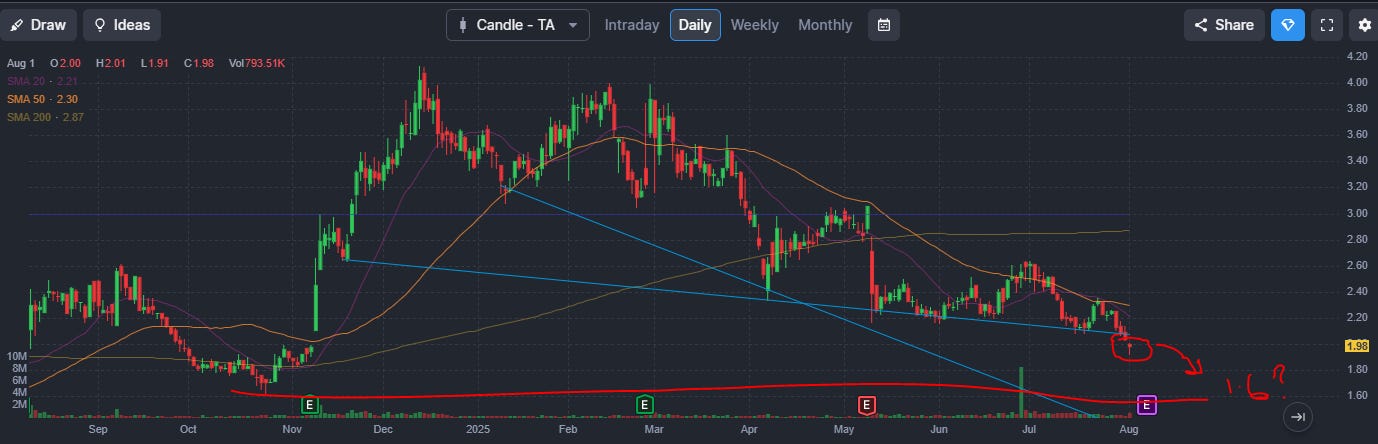
We are at 1.98$ per share now, and given that we broke an important support level, I wouldn’t be surprised if we reached 1.6$ a share. Then, depending on how the fundamental thesis is going (maybe the shitty reviews stop) Id scoop up shares at around 1.3$-1.6$… Unless it explodes higher and goes above the moving averages with improving fundamentals.
Ragnarok Research’s latest actionable idea
Taking every explained above into account, here is a small company that has picked my interest. This name is actively repurchasing shares, small enough to not be on anyone’s radar, in a great technical position, and I think that there is scope for income statement growth.
Ticker: GROW; US. Global Investors Inc.,
Now, why am I interested in this name ? Let’s put on our forgotten-child investing lenses:
Forgotten child investing lens:
Market cap: 31 Million dollars
Cash: 27.3 Million dollars
Total Liabilities: 2.6 Million dollars
Effective net cash = 24.7 Million dollars
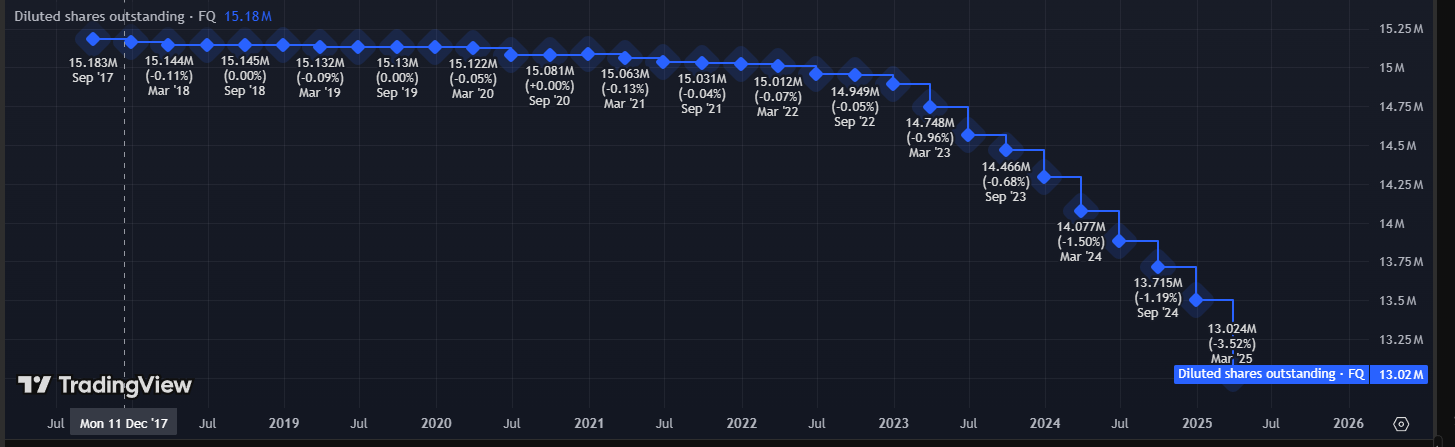
A company that has almost 25 million dollars in cash against a market cap of 31 million dollars is awesome when seen through my balance sheet value lens! And moreover, the company seems to be returning capital as well through buybacks:
Moreover, in this piece put out by GROW themselves, is outlined clearly how committed GROW is in servicing its shareholders, and how there has been a buyback program since as early as 2012 and has been renewed each year:
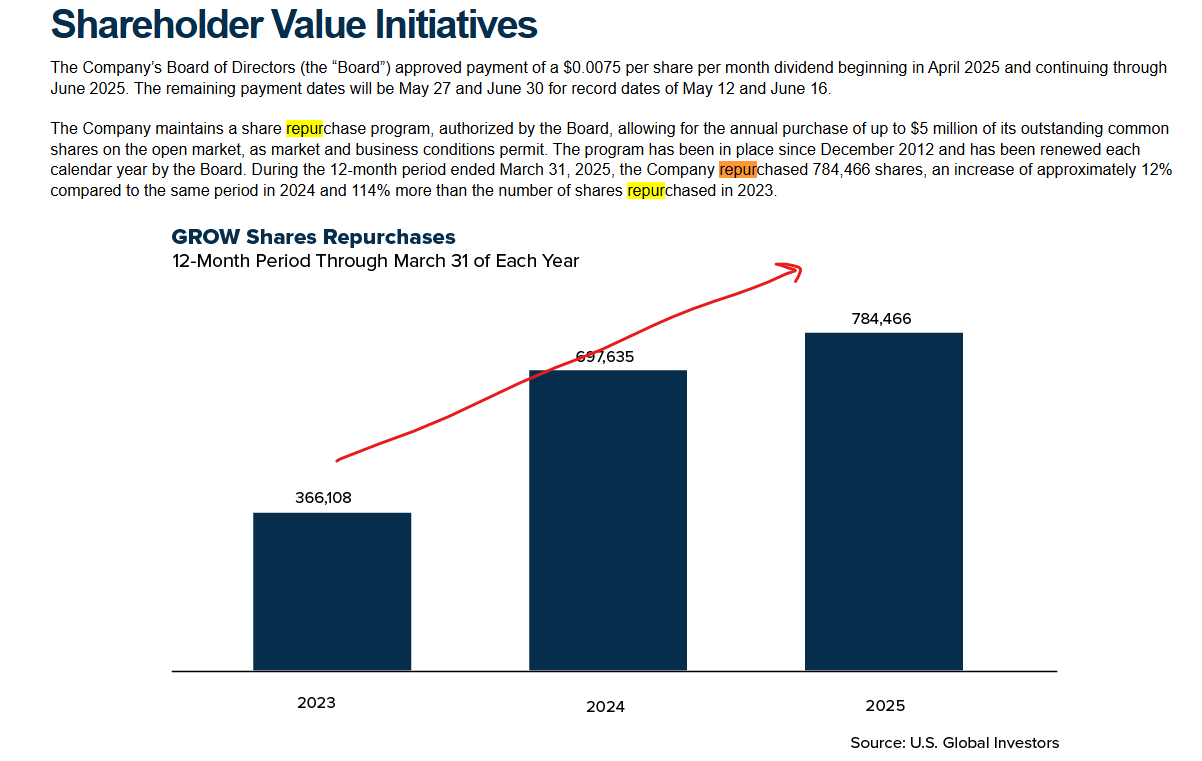
From a balance sheet value perspective, I think now is a great time to buy, because it is the first time in frankly a long time that the net cash position is a huge percentage of the balance sheet, and it is only now that any buyback efforts will start to yield fruit in my opinion, since there is actually a valuation gap left to be closed.
FORGOTTEN CHILD LENS VERDICT: 8/10. It could have been higher if the net cash position was more than the market cap, but I’m not gonna complain! This is a company committed to returning capital to shareholders
Income statement value lens:
Now that we have taken off our capital allocation /balance sheet value shares and put on our income statement value lens, let’s see how revenue and net income is trending:
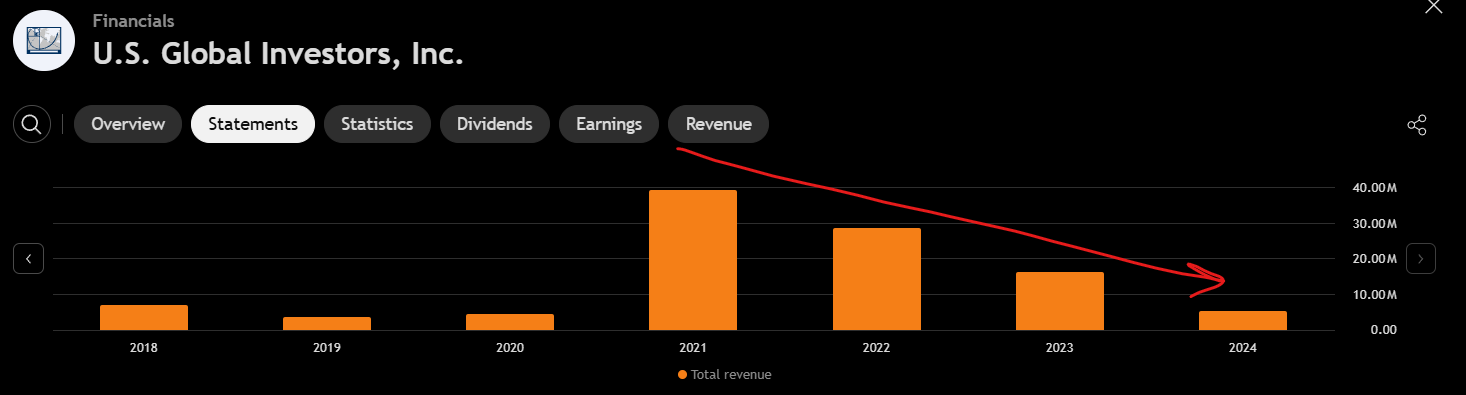
Not looking good
Now, US Global investors is basically an investment manager that runs a bunch of ETFs, and according to its 2024 10-K of the period ended June 2024, the largest ETF in terms of AUM that GROW managed was ‘JETS’:
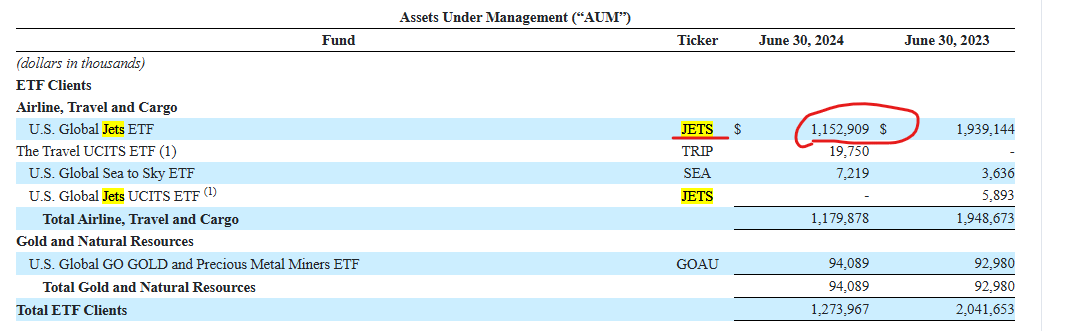
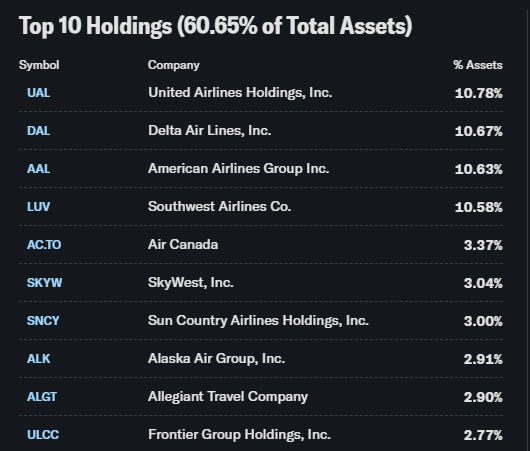
Roughly around 80% of the company’s assets are tied up at JETS. Now, JETS’ investments are mainly airline stocks, airport operators, and things of that nature:

Now I don’t consider myself a macro investor by any means whatsoever (I’m not as cool as James Fishback), but I am looking for anything that can give me color on the future of GROW’s net income, and when someone mentions a capital intensive business such as airlines or anything of that nature, the macro backdrop is very important to consider. So the top 10 holdings constituting 60% of the ETF are the following:
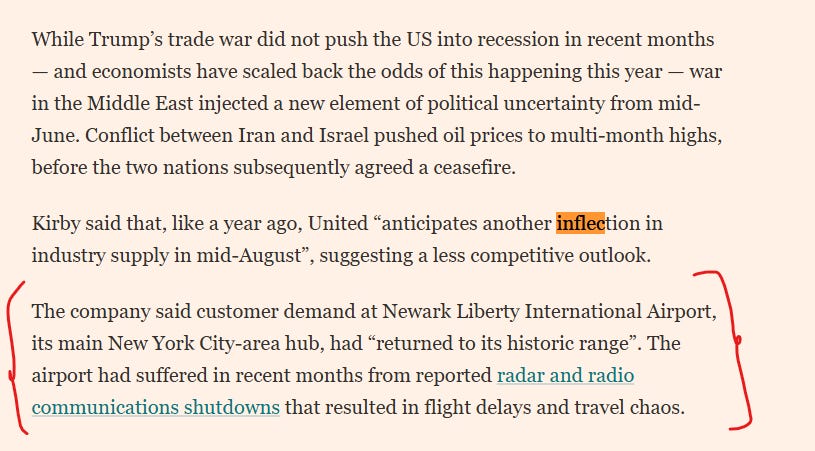
Now we all know what’s happening with Trump and Powwow, and the whole labour numbers ordeal that unfolded last week. Now I have seen a flurry of FT articles looking like the following:
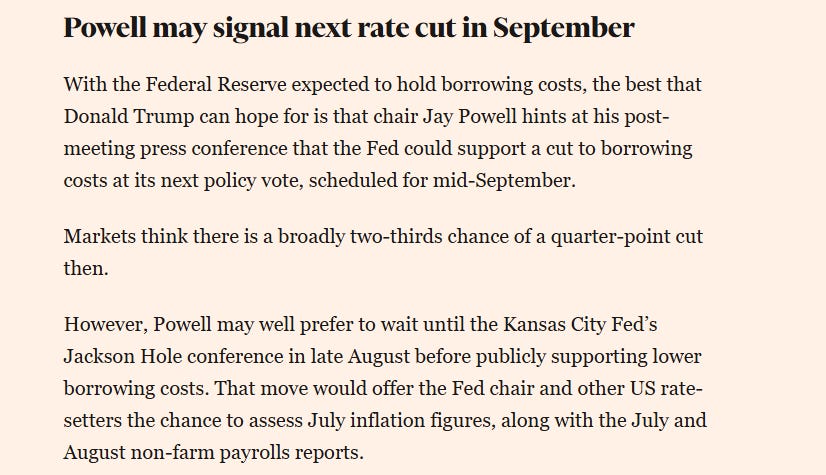
If Powwow does lower rates, I would think capital intensive businesses such as airlines will benefit from this and the shares would rise in a meaningful way atleast in the short term, hopefully giving some meaningful fees to GROW. Nevertheless though, the JETS ETF has been doing pretty well since the broad-market Jan-April selloff, being up about 30%:
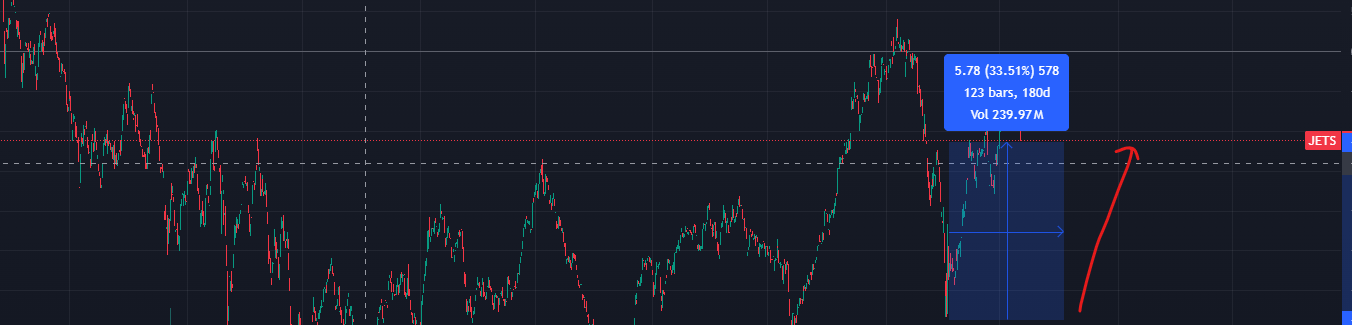
This selloff is what we think is the main cause of disappointing revenues for GROWW, due to less fees and more outflows registered by GROW. However, we expect a slightly better quarter ending June, since it’s practically been a rally. Moreover, a drop in interest rates according to me would spur a mini-rally in names that JETS holds such as DAL, UAL, etc, giving GROW some extra bread:
One risk of course is, is higher rates = higher fuel prices = less net income for arlines resulting in falling stock prices. I however am sort of hoping for the following two things:
Travel demand increases enough to compensate for rising net income due to potential oil price rise
Political climate cooling so oil prices don’t shoot up toooo high.
Nevertheless, I think the airline industry might be in decent shape, considering more people are searching for flight bookings now, than in the past 5 years in the States:
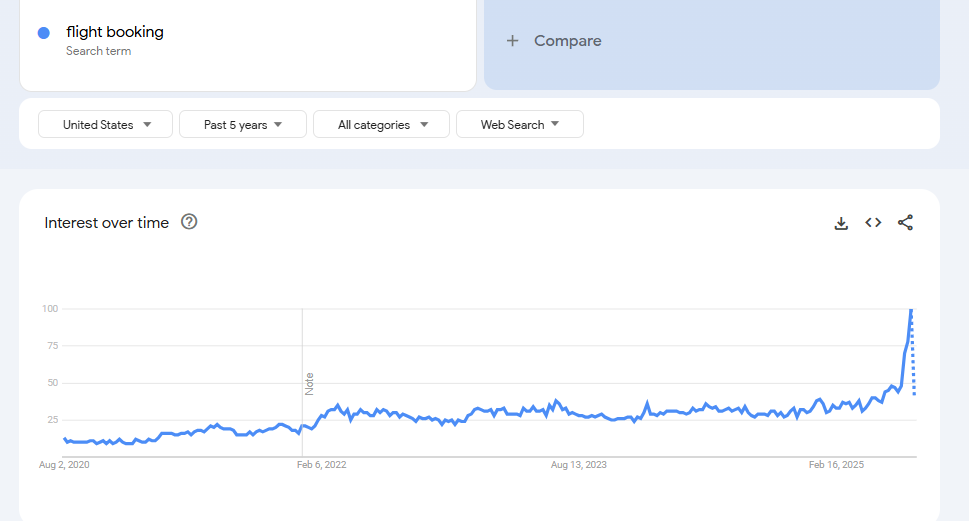
VERDICT for income statement value lens: I think that the near term future outlook of GROW is a 7/10 due to recent performance of the JETS ETF being pretty good, and owing to my prediction that a drop in rates will help airline stocks a good amount, and amid the industry supply inflection mentioned in the ft article above (dunno if its true but just the macro interest rates thesis can enable me to sleep well at night)
Technical Analysis:
On the daily chart, here is what GROW looks like:
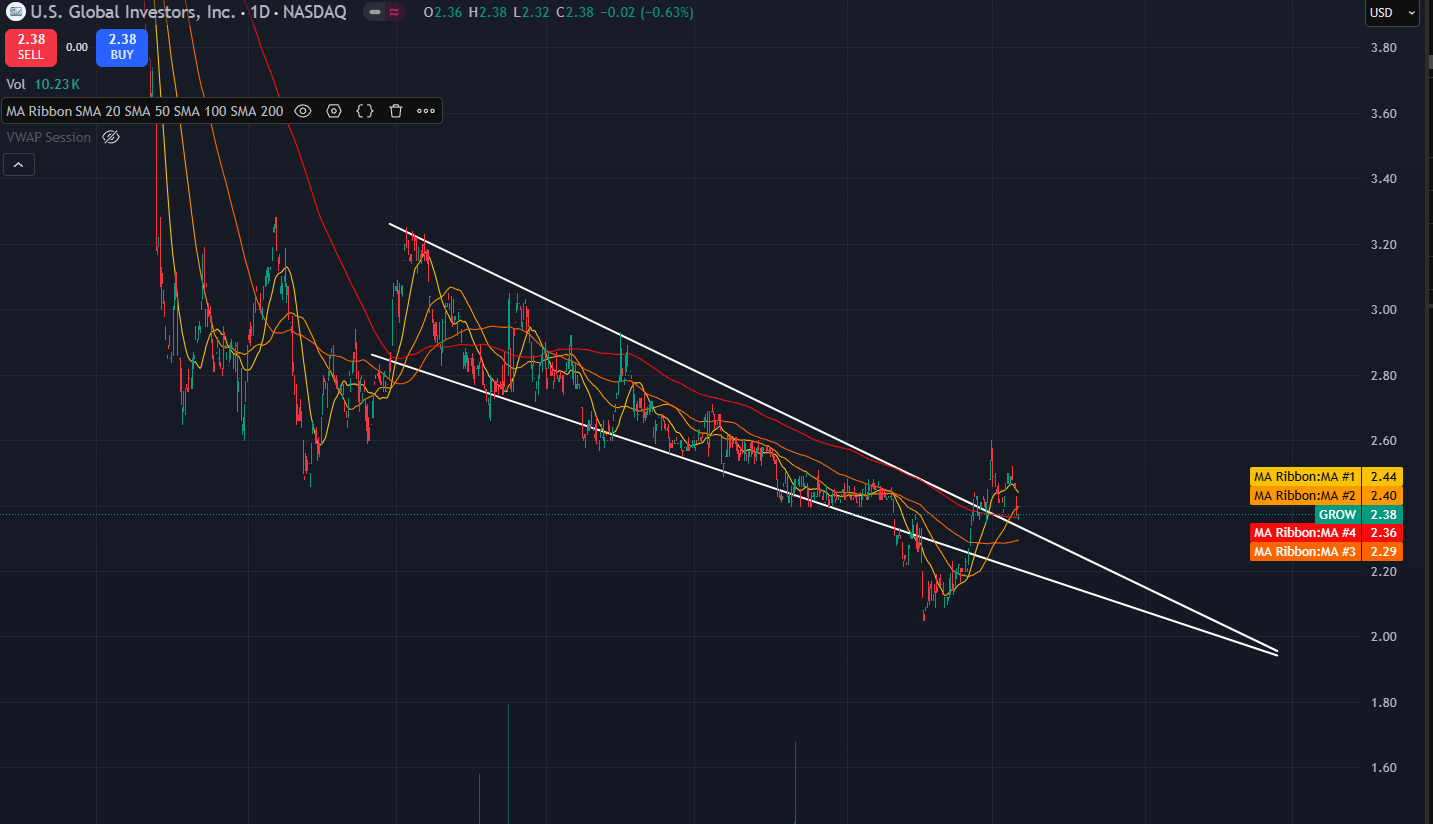
As you can see, GROW broke out of the downtrend that it was trapped in for a long time, and now is experiencing a small pullback back to the support levels and moving averages:
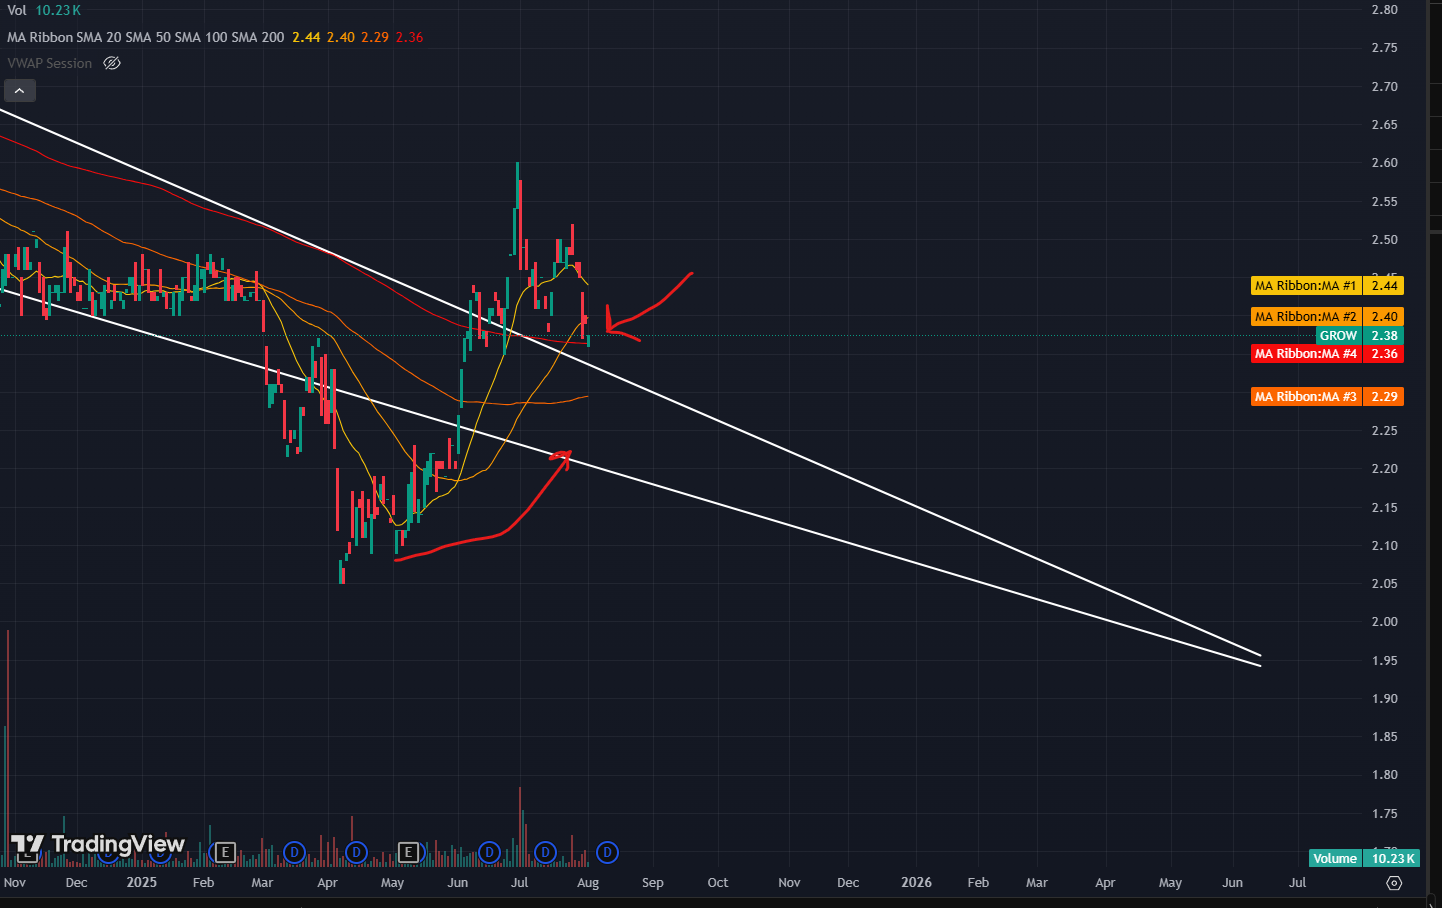
Notice how the price fell back to the red line (200 day mving average) and ended the green with a green candle … on a day that SPY was down almost 2%! This levels acts as a strong support level, and I have started a small position here. And by small, I mean about 1% of my portfolio, nothing much. I do however want to size up by a lot. I have decided to increase my stake when the price crosses the 50 day moving average and ride the wave until it hits 3$ a share, where I would want to trim my position, since the balance sheet value would be a little lower with the increased market cap compared to the net cash position.
However, if the price falls from here, I wouldn’t mind (it’s just 1% of the portfolio after all) and it would actually be a good thing since the balance sheet value would be increasing (well, if the reason for the decline isn’t broad market movements, and it is something that can shatter the income statement value, then it’s bad of course), and I will be eager to pick up shares even below when I start to see some technical inflection.
On the weekly chart, here is how it looks:
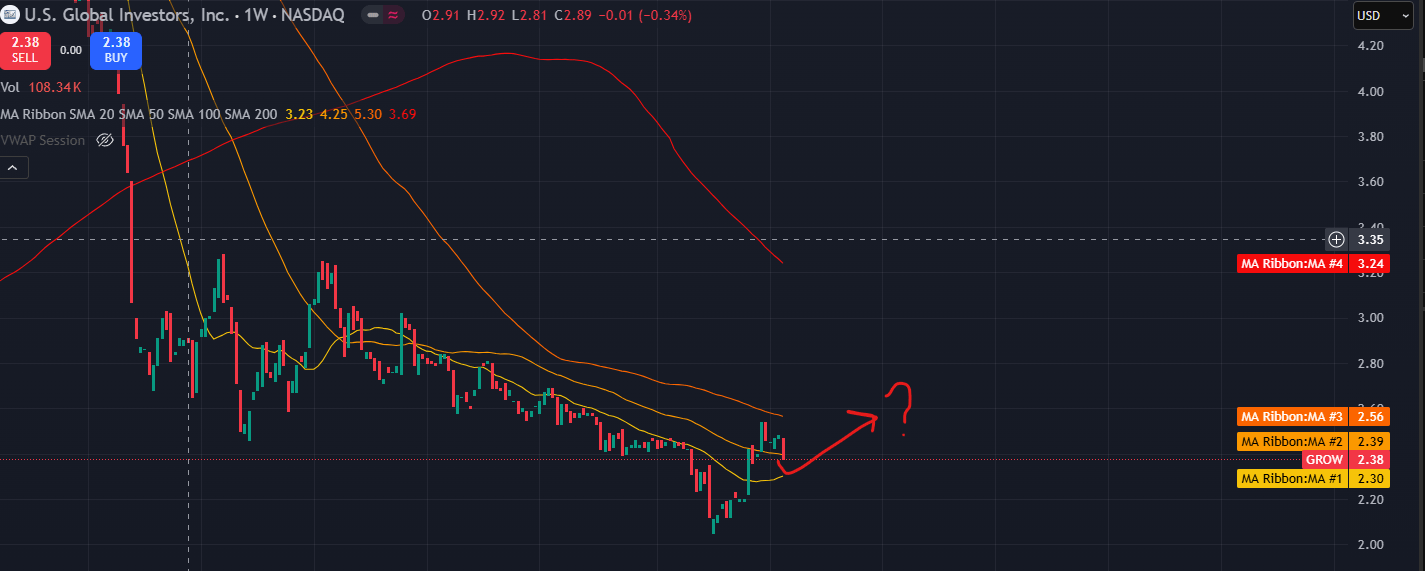
Obviously I am not too pleased with the price breaking through the 100 -week moving average, but the 20-week moving average is just 3% below the current price, and if it reaches there, I will try to size in there just a tiny bit, and if there is a meaningful technical inflection, I’ll average up!